
Using Financial KPIs, also referred to as Key Performance Indicators, in your business is a useful way of communicating success, or progress towards success with your team. Working together on numbers that everyone can influence fosters collaboration and innovative thinking. This guide will walk you through the principles of financial KPIs, it’s use cases and how to get started using KPI software like Calxa.
What Are Financial KPIs?
Financial KPIs are a performance measurement tool designed to help you reach your organisational goals. Whether you are aiming for commercial success or to achieve some other social goal, measurement is important.
It tells you whether you are on track, whether what you are doing is working or not.
Key Benefits of Financial KPIs
First, you must work out which Financial KPIs will enhance your business. Then, as a second step, you need to find regular time slots to review your KPIs. This may seem to you like an effort, but there are benefits to setting and reviewing financial KPIs:
- Drive Goals: Financial KPIs are a guide to achieving specific outcomes.
- Achieve Objectives: KPIs can be used to motivate employees to work towards departmental objectives and really drive success for your organisation.
- Monitor Performance: KPIs are vital in monitoring the accomplishments of your organisation. Keeping track of performance is a crucial element in maintaining efficiency.
The Difference Between Financial KPIs and Non-Financial Metrics?
While sometimes the term Metrics is used interchangeably with KPIs, in Calxa we use it in a narrower sense. Metrics are the non-financial numbers that you collect in your organisation.
Sometimes Metrics are valuable in themselves. For example, the current number of customers is a very important metric.
Other times, they are useful to combine with other information to build your Financial KPIs. For instance, the total number of transactions you do each month is interesting if you are a retailer. It gives you an idea of how busy you have been. It is more useful though to combine it with your total revenue to calculate the average size of a transaction. This is particularly important, if you have a goal of increasing your per customer spend. This could be an important KPI for discussion with your team.
SMART Goals
A popular acronym in goal setting over the past few decades is SMART. The idea is that your goals should be:
- Specific,
- Measurable,
- Achievable,
- Relevant
- And Timely.
When done well, these goals will help to focus your effort, and that of your team. This will improve your chances of attaining your targets. KPIs are an intrinsic part of SMART goals as they provide the measurement.
Develop systems to gather the right information and then bring that into Calxa as Metrics. This non-financial data is quite different to the data you get in your accounting system. Combining the two, Calxa can then provide those timely reports to your team. This keeps everyone informed of progress on a regular basis.
Getting timely information on your progress towards your goals allows you to be agile in responding to change. When progress towards one goal is exceeding expectations, you can choose to reduce the effort in that area and apply it to other parts of your business. This will drive the goals behind those other targets.
Having the right financial KPIs and non-financial Metrics will help you achieve your SMART goals.
Alternatives to SMART Goals
SMART goals work well within a known environment and a relatively short time frame. They are less useful for ambitious long-term goals, or goals focussed on continuous growth rather than a specific achievement.
Both MIT’s FAST goals and the CLEAR method, developed by Olympic Gold medallist Adam Kreek, focus much more on collaboration and communication of goals. They have an emphasis on adapting the goals as you progress and learn.
But even so, they all stress the importance of measuring your progress. And that’s where KPIs and Metrics are the cornerstone of that measurement. The key is then to regularly discuss with your team what is working and what’s not so that you can change what you are doing to achieve your goals.
How Do KPIs and Metrics Work in Calxa?
In Calxa, you use the KPI Builder to develop the formulas for your KPIs. These are based on Account Groups and Non-Financial Metrics. The formulas can be very simple, or they can be complex and span several lines. Bear in mind that you can report directly on Metrics anywhere in Calxa where you can choose KPIs.
KPI Account Groups
Account Groups are key building blocks for your KPIs. Use them to collate the financial data you need by summarising the individual accounts that you need. There are 3 types of Account Groups:
- Period Movement: This is the most common and gives you the numbers for whatever date range is used in a report.
- Closing Balance: This is usually used with balance sheet accounts and gives the value at the end of the period. Perfect for a KPI based on a bank balance, for example.
- Annual Movement: The least-used option, this gives you the annual movement for the 12 months to the end of the report. You’ll see it used in the built-in Debtor Days and Creditor Days KPIs.
Most of the built-in Account Groups are read-only but there are some you can change. Wages, for example, defaults to the accounts nominated in the Cashflow Settings. However, you can use a different definition here. Another example is the Breakeven Analysis KPI. It uses 2 Account Groups, Fixed Costs and Variable Costs. The latter defaults to your Cost of Sales accounts and can’t be changed. You can, however, change the Fixed Costs from the default of all Expense accounts. If you add or remove an account from Fixed Costs, Calxa automatically changes the Variable Costs.
If you are reporting across multiple companies, you don’t need to create new Account Groups in each entity. However, you will need to match them to the right accounts in each individual company.
Non-Financial Metrics
Metrics are created under Reports, KPIs & Metrics and then edited in the Budget Builder. Notably, when creating them you can group them for convenience and also choose which organisations or business units they apply to. Some may be only relevant to one company or department, some make sense to apply across the whole group.
You can add as many Metrics as you need but note, there are 3 types:
- Sum: The one you will use most often. It adds your numbers across the date range of your reports.
- End: Use this where you just want to use the value in the last period on your report.
- Average: Reports will use the mean of the values of the periods covered.
For example, use Sum for the number of new customers each month. However, use End for the total number of active customers.
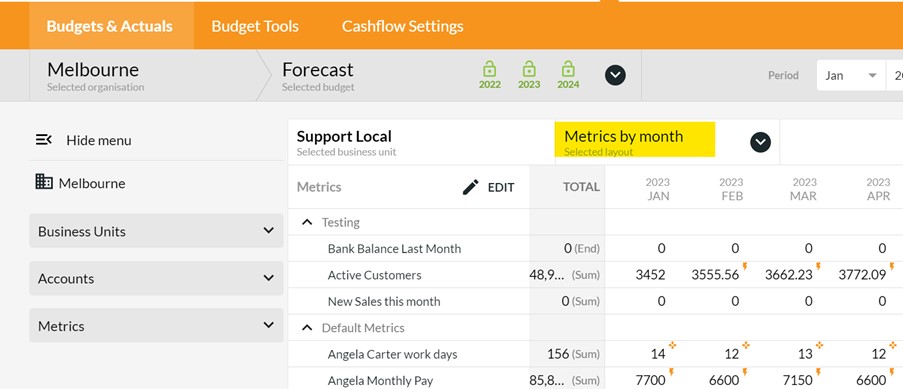
The most common way to edit the values of your metrics is in the Budget Builder. Select the organisation and/or business unit and switch form Accounts by month to Metrics by Month.
The Calxa KPI Builder
It is worth reviewing some of the built-in KPIs before you start. This will give you an idea of how formulas are constructed. Some, such as Cash Balance, are really simple. It just uses an Account Group of Default Bank. That account group is initially based on the bank accounts you’ve set in the Cashflow Settings, but you can edit it independently.
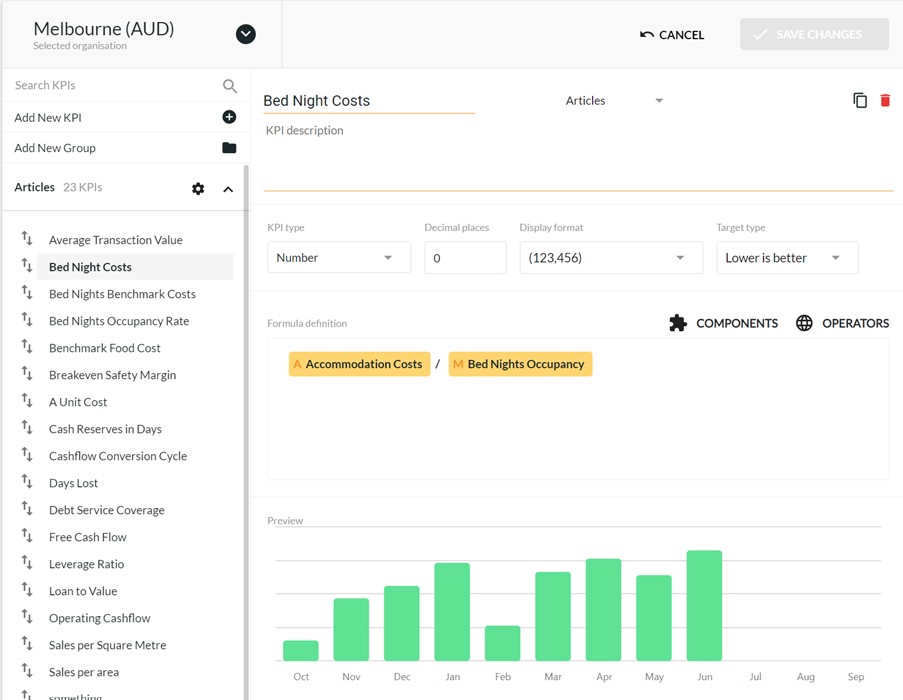
If you look at the Cost of Sales KPI, for example, you will see that it has a simple calculation of:

The A at the beginning tells you that the values have come from an Account Group. M would imply Metric, K would be another KPI.
While you can’t change any of the built-in KPIs, you can copy them and use them as a starting point for your own reporting. When entering your own KPIs, you can either start typing if you know the components you want or select them from the Components menu.
Sorting and Grouping of KPIs
To keep your KPIs easy to manage, arrange them in groups. Within each group, drag them up and down to the sequence you want. When you add KPIs to a report, they will sort in this same order.
Reporting with KPIs
You can add KPIs to the end of all budget reports and all the P&L reports in Calxa. For more flexibility, you can include them in an Account Tree under any header. In addition, the Business Unit KPI Comparison Report shows selected KPIs from multiple business units within an organisation or many entities within a Consolidated Group.
You can then sort by any of the KPIs. Use this, for example, to see which of your companies or departments have the highest Net Profit.
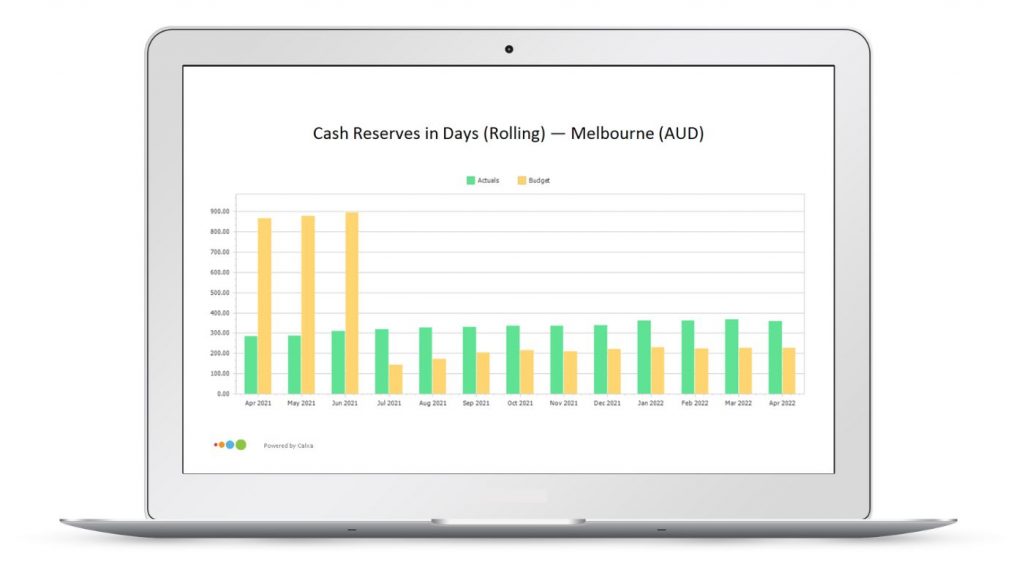
There’s also a selection of bar and line charts to present your KPIs graphically. The KPI Analysis Charts show one KPI compared to budgets or the previous year. Whilst the Multi-Period charts give you most flexibility with time periods. Choose between months, quarters or years and then the number of periods to show.
Tip: Run the Multi-Period chart for 13 months starting at Relative -12 (12 months before the report period). This will give you the most recent month, the same month a year ago and the trends in between.
The Cumulative KPI Analysis Chart is useful for tracking year to date progress on a KPI. It will show the accumulated year to date value compared to the budget.
When you want to compare one KPI to another or to multiple KPIs, use the KPI Comparison Line Chart. Add as many KPIs as you want to see how they move over time.
Tip: It’s a simple Report Designer customisation to change the KPI Comparison chart from a line chart to a stacked bar chart.
KPIs on Dashboards
Dashboards are made for KPIs. They are great for displaying a set of numbers graphically in one place. Group your KPIs (or Metrics) onto related dashboards to suit the needs of your audience. Without going into too much detail, the basic plan would be:
- Add a Data Source that includes the metrics and KPIs you want to display
- Create a new dashboard in the Dashboard Manager and attach your data source
- Add tiles from a template for each chart you want to use
- Arrange the tiles for maximum effect
Use Metrics for a Management Dashboard or they are useful for a Board Report Dashboard. If you’re not sure how to deliver your KPIs, have a read of our Dashboards vs Reports comparison.
Reporting KPIs on a Rolling date range
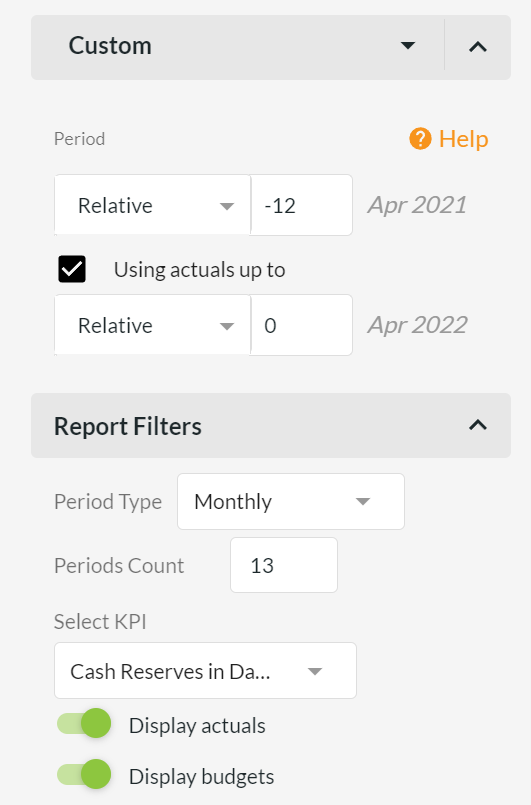
Often, a financial year isn’t the best date range to use for a KPI report. You want to see, for example, the previous 12 months. You can easily achieve this with a custom date range in the report filters.
- Include the start period set at Relative -12. This will then always start one year before the Report Month.
- Now look at the Using Actuals up to and set this as Relative 0. This will give you actuals up to the report month
- Make sure the Period Count is set to 13. This will give you the same month last year and the trends in between.
How to Use Financial KPIs and Non-Financial Metrics
There are many uses for Financial KPIs. Here we go through some scenarios showing which KPIs and Metrics would be suitable. And, of course, how to create them.
Financial KPIs for Business Performance
If you are just starting out with Financial KPIs, these 3 will measure your business performance.
- Wages to Turnover
- Gross Profit Margin
- Cash Reserves
Have a look at the breakdown of how you get these three financial KPIs as part of your Calxa.
1. Wages to Turnover
This is one of the built-in KPIs in Calxa. However, as we mentioned earlier, you can edit the Wages Account Group to define wages the way you need.
2. Gross Profit Margin
The Gross Profit Margin is one of the core accounting ratios. It shows the proportion of your income that is returned as profit, after deducting direct costs. It also is a standard Financial KPI in Calxa.
3. Cash Reserves
How long could your business survive if there was a sudden drop in income? What used to be a hypothetical question was brought sharply into focus in 2020 for many organisations.
The key to calculating this is to estimate your daily expenses, excluding the non-cash ones. Calxa has a default Account Group for Annual Expense which gives the annual movement on all your expenses. Create a similar group and set it as Annual Movement for items like depreciation that should be excluded.
In the Balance Sheet section, there is a standard Account Group for Default Bank which includes the bank accounts nominated in your Cashflow Settings. You have the option of adding extra accounts here such as a savings or investment account.
The Cash Reserves KPI formula is then simply:
Default Bank / ((Annual Expense – Non-Cash Expenses) / 365))
This article Top 3 Business Key Performance Indicators goes through these 3 KPIs in more depth.
KPIs For Cash Management
Cash management is important for almost every organisation. These KPIs will give you an early warning of impending cashflow problems. We wrote an extensive article 7 Important Business KPIs for Cash Management to help businesses during the COVID-19 pandemic. Here is a quick summary for you:
Cash Balance
Watch the trends and seasonal patterns in your bank balance and be alert to any unexpected decline.
Debtor Days
This measures how quickly you are collecting payments from your customers. If it is increasing, look at your collection processes.
Creditor Days
If you are having trouble paying your suppliers, there will be an increase in the average creditor days outstanding. It’s a significant signal that you might need help with your business.
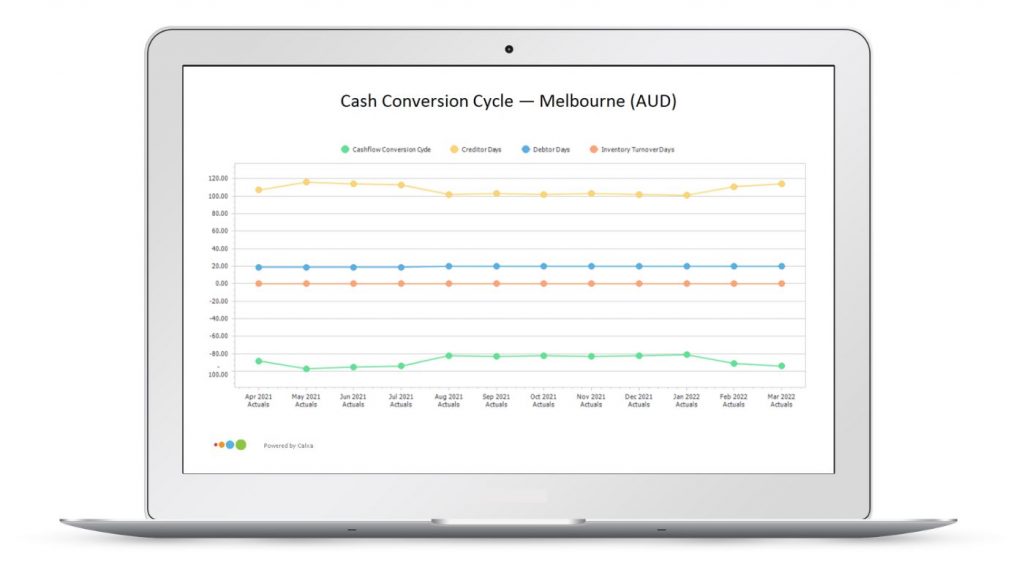
The Cash Conversion Cycle
Use this Financial KPI to understand how quickly you turn the goods you buy into cash. It incorporates:
- The time you hold the stock,
- How long it takes your customers to pay you
- And, how quickly you pay your suppliers.
Keep it as low as possible while maintaining good terms with your creditors. The formula for this Financial KPI is:
Inventory Days + Debtor Days – Creditor Days
Use the KPI Comparison line chart to show the different components of this chart all together.
Working Capital Ratio
This built-in Financial KPI compares your Current Assets to your Current Liabilities. A value of less than 1 (or 100%) is a sign of a potential cashflow issues. It says that for every dollar you owe, you have less than a dollar in assets and that is a sign you could have trouble paying. For more details, see our What is a Working Capital Ratio?
Cash Reserves in Days
As we discussed above, a decline in your cash reserves is often a precursor to business failure.
Operating Cashflow
The Operating Cashflow KPI measures the cash generated by a business in any given period. This is how you would calculate this Financial KPI:
Net Profit + Non-Cash Expenses + Change in Working Capital
Free Cash Flow
Free Cash Flow adds interest and deducts capital expenditure from Operating Cashflow. Watch out for declining values over time.
Operating Cashflow + Interest – Capital Expenditure
Not all of these Financial KPIs will be relevant to your organisation so review them all first and then pick the ones that are likely to help you reveal your problems. This will allow you to address them early.
Balance Sheet KPIs
Do your eyes glaze over when presented with a Balance Sheet report? You may find it simpler to use some simple Financial KPIs to understand what’s happening.
The Working Capital Ratio
You want to see a value greater than 1 to avoid cashflow problems in the future.
Debt to Equity Ratio
This Financial KPI, also known as the Leverage Ratio, compares how much of your business if financed by loans rather than equity. Incoming investors generally prefer to see more equity and less debt. It’s also one of the important ratios used by banks when assessing loan applications.
Average Debtor Days
How soon do you collect payment on your invoices? Improve this to improve your cashflow.
Average Creditor Days
Watch this isn’t increasing as that’s an early sign of cashflow difficulties.
This article Balance Sheet Analysis Using KPIs is a great entry point to start looking at these financial KPIs periodically.
Financial KPIs for Payroll
Wages often form a large business expenditure. To keep an eye on this outgoing spending, set up some Financial KPIs that will give you an overview.
Payroll as Percentage of Revenue
Also known as Wages to Turnover Ratio. This is a built-in KPI in Calxa but you can modify the Wages account group. You might, for example, want to include annual leave accruals, overtime or other accounts.
Wages / Total Company Revenue
Cost of Payroll Per Employee
This financial KPI formula is simply:
Total Payroll Amount / Number of Payees
Team Productivity Rate
Sometimes known as Revenue per Employee.
Total Company Revenue / Total Number of Staff
Workdays Lost
Record the number of workdays lost each month as a Metric. Create another Metric for Available Workdays and use a repeating formula to calculate how many days there are each month.
Lost Workdays / Available Workdays
Doing a deep dive into your payroll costs will give you a good idea how your business is tracking. It will help you benchmark your business. This article Payroll KPIs to Benchmark your Business will get you started.
Financial KPIs for Loan Applications
A 3-way forecast is often the first thing your lender will ask for. But, even if they do not ask for them, they’ll be looking at these KPIs too. You would be well served to understand them first, so you are prepared for any questions. The Financial Ratios for Loan Application article gives you a bit more insight on why these are important for the lenders.
Debt Service Coverage Ratio
This is an incredibly important ratio when applying for a loan.
Net Profit / (Interest payments + Principal Repayments)
Ideally you want a ratio of 10 or more.
Leverage Ratio
Also known as Debt to Equity, this is a standard KPI in Calxa.
Loan to Value Ratio
A value of 0.6 is a common ceiling for business borrowings. That represents $100 dollars worth of collateral or security for $60 worth of borrowings.
Loan Amount / Asset Value
Financial KPIs by Industry
Each industry has different benchmarks that signal the performance of the business. Here are some ideas on various Financial KPIs depending on the business sector.
KPIs for Dairy Farmers
The farming industry deals in larger quantities for production. Financial KPIs are particularly important to control seasonal factors.
A dairy farm, for example, may want to use a Metric for kg Milk Solids. You can then enter budgets and actuals each month.
Revenue Per kg MS
Dairy Revenue / kg Milk Solids
Cost Per kg MS
Dairy Costs / kg Milk Solids
Profit Per kg MS
(Dairy Revenue – Dairy Costs) / kg Milk Solids
Follow the steps outlined in this article KPIs for Dairy Farms to get you started.
KPIs for Hotels and Restaurants
Add these Financial KPIs and Non-Financial Metrics to your monthly management reports. You can read the Metrics and KPIs for Hospitality article and follow this as your guide. But here are the key metrics for use by hotels, cafes or restaurants:
Accommodation: Occupancy Rate
Rooms sold / Rooms available
Accommodation: Average Daily Rate
Total Room Revenue / Rooms sold
Accommodation: RevPAR (Revenue Per Available Room)
Total Room Revenue / Rooms available
Food Service: Food Cost
Food Cost / Food Sales
Food Service: Food Cost Per Head
Food Cost / Number of Customers (covers)
Food Service: Average Sale
Food Revenue / Number of Customers
Food Service: Labour Cost
Kitchen Wages / Food Revenue
Financial KPIs & Non-Financial Metrics for Retailers
Trading in the retail industry can have some seasonal fluctuations. Knowing your baseline will help you identify changes early. This is where financial KPIs can help.
Gross Profit Margin
This is one of the standard KPIs in Calxa but if you want to calculate it yourself, it’s simply:
Gross Profit / Total Income
Net Profit Margin
The formula for the Net Profit Margin is again a simple one:
Net Profit / Total Income
Sales per Square Metre
You’ll need to know the area of your shop and then the formula is simply:
Total Sales / Shop Area
In Calxa, add a Metric for your Shop Area. Make sure to set the calculation type to End so it doesn’t accumulate when you run a multi-period report. Then use this formula in the KPI Builder.
Sales per Employee
Total Income / Number of employees
Average Transaction Value
Total Income / Number of Transactions
Inventory Turnover Days
Inventory / Annual Cost of Sales x 365
Visitor Conversion Rate
Total Visitors / Total Transactions
Our article 7 KPIs for Retailers goes through the details of how and when to apply these financial KPIs.
KPIs for Bookkeepers
We know that often bookkeepers are so busy working tending to their clients’ needs, they forget to check on their own Practice. Having a healthy business, means you are going to be around in the future to continue doing the great work. If you are a time-poor bookkeeper, starting with these KPIs for a Bookkeeping Practice gives you a quick return for the time invested. As a result, you ensure your business’ health.
Average Revenue per Client
Total Income / Active Clients
Cost of Acquisition
Sales & Marketing Costs / New Clients
Churn Rate
Lost Clients / Active Clients
Lifetime Value
Split your formula over multiple lines to make it easier to read and maintain.
GP per Client = Gross Profit / Active Clients
Churn Rate = Lost Clients / Active Clients
GP per Client / Churn Rate
Customer Value
GP per Client = Gross Profit / Active Clients
Churn Rate = Lost Clients / Active Clients
Lifetime Value = GP per Client / Churn Rate
Lifetime Value * Active Customers
KPIs for the Construction Industry
Construction businesses often deal with large transaction values. Whilst checking in on each project with a fine toothcomb, there are some other measurements that help you stay profitable. Use these KPIs to keep a check on your business.
Wages to Turnover
Wages to Turnover is a standard KPI in Calxa and can be used at the project or organisation level. If you use subcontract labour you can edit the KPI Account Group for Wages to include this expense as well.
Revenue per Labour Hour
Total Income / Hours Worked
Days Lost/Month
Simply record a Metric for the working days lost each month. Then the formula is:
Days Lost
Interest Cover
Operating Profit / Interest payments
Cost per Kilometre or Square Metre
Total Project Costs / Kilometres built
This article 5 Important Construction Performance Metrics and KPIs extends on the above in more detail.
KPIs for the Fitness Industry
The gyms have been hit hard during the pandemic. Besides revenue and profit, there are some vital financial KPIs that help a fitness studio track their performance.
Revenue per Member
Total Income / Active Members
Cost per New Member
Sales and Marketing Costs / New Members
Marketing Cost Recovery
This is the cost per new member divided by the revenue per member:
(Sales and Marketing Costs / New Members) / (Total Income / Active Members)
Churn or Retention Rate
Lost Clients / Active Clients
Revenue per Square Metre (or Foot)
Total Income / Gym Area
This article 5 Fitness Industry KPIs will explain the why around these financial KPIs.
KPIs for Travel Agencies
For the Travel industry, tough times make KPIs even more important than usual. It’s important to make the most of every opportunity and keep a tight rein on expenses. Here’s a selection of KPIs commonly used by travel agents:
Total Transaction Value
Also known as TTV, this is the gross value of sales relating to travel services. Create an Account Group to nominate the right accounts and then the formula is simply that group name:
TTV
ATAS Cost of Compliance vs TTV
ATAS is the Australian regulatory scheme for travel agents and it’s common to track compliance costs and compare them to revenue:
ATAS Compliance Costs / TTV
For more examples from the travel industry see our 10 examples of KPIs for Travel Agency Managers.
SaaS KPIs
The technology sector is a specialised industry that works mostly on a subscription pricing model. This lends itself to a bunch of performance tracking benchmarks. Any SaaS business is likely to be using these metrics on a regular basis.
CAC – Customer Acquisition Cost
Sales & Marketing Expenses / Number of new Customers
ARPS – Average Revenue per Subscription
Total Subscription Revenue / Active Customers
CAC Recovery Months
CAC / ARPS
Active Customers
Total number of active customers
Churn
Customers Lost / Active Customers
Lifetime Value
ARPS / Churn
Lifetime Value to Cost of Acquisition
Lifetime Value / CAC
Customer Value
Lifetime Value x Active Customers
AMRR – Annualised Monthly Recurring Revenue
Current monthly revenue x 12
NRRR – Net Revenue Retention Rate
(Monthly Revenue at start + expansion revenue – contraction revenue – churn) / Monthy revenue at start
See 10 Common Saas KPIs for more detailed explanations.
Conclusion to Financial KPIs
So, there you have it. A range of Financial KPI formulas to choose from. It covers various scenarios and a good number of different industries.
If you have never created Financial KPIs, don’t panic. Most of these financial KPI formulas are calculations you probably are already doing in some form or shape. The key is to formalise these KPIs and look at them regularly. This will give you an opportunity to develop a pattern and a trend line which will help you better run your business.
If you are already doing financial KPIs, watch this webinar recording KPI Tips Tricks and Metrics to do more with your Calxa software.