Running a dairy farm is hard work. Natural forces such as rain may reduce your output. Bright sunny days may yield faster production. KPIs for Dairy Farms is an easy to follow article to help better manage the business and prepare dairy farmer reports. So how do you measure the success of your dairy farm? How do you know if it’s going well or not? The simple solution is to check that you have some money in the bank (but we all know that doesn’t tell you a lot). Having cash saved away, is certainly no great indicator of whether there will be any left next week, next month or next year.
Smart farmers use KPIs not just to measure their own performance over time but also to compare it to other farms. In the dairy industry, the standard unit to look at is a kilogram of milk solids (kg MS). By knowing your costs, earnings, break-even point and profit per kilo of milk solids, you can compare how well you are doing against other farms. If you’re falling short in one area, you know that’s where you should focus on improving.
Where do you find these numbers?
Your accounting system on its own isn’t going to tell you what you need to know; it’s great for working out your overall profitability, for keeping track of invoices and paying bills, making sure your staff get paid on time. However, you need to add a good reporting tool to get down to the nitty gritty.
The KPI editor in Calxa will help you immensely: you can add Metrics for the non-financial data, create KPIs that will give you charts you can monitor your performance against. Then you can add your metrics and KPIs to a Report Bundle and schedule them to arrive in your inbox. Your reports will appear as simple graphical data that is easy to read and doesn’t require you to have an accounting degree to understand what is going on.
Getting Started with KPIs for Dairy Farms
For the simplest start, create a Metric for kg Milk Solids Produced – you can expand on that later to create other KPIs based on the number of cattle you have or the area of productive land – but for now start simple.

Put in a monthly budget for your expected production for the year and then, each month, update with what you’ve actually produced.
Creating the KPIs
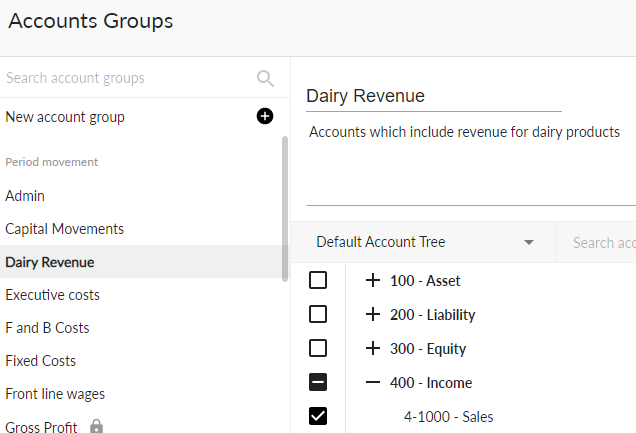
First up, you’ll need to create Account Groups to summarise your revenue and costs. You will find this under Reports, KPIs, KPI Account Groups.

Now create KPI formulas for the numbers you want to report. These three values make great KPIs for Dairy Farms. Once you have Account Groups set up for Dairy Revenue and Dairy Costs, the formulas are simple:
Revenue per kg MS
[Dairy Revenue] ÷ [kg Milk Solids]
Cost per kg MS
[Dairy Costs] ÷ [kg Milk Solids]
Profit per kg MS
([Dairy Revenue] – [Dairy Costs]) ÷ [kg Milk Solids]
As long as you’ve named your Metrics and Account Groups the same, you can copy and paste the formulas from the examples above. Alternately, just start typing and the formula will auto-select the nearest match.
Seeing KPIs for Dairy Farms Results
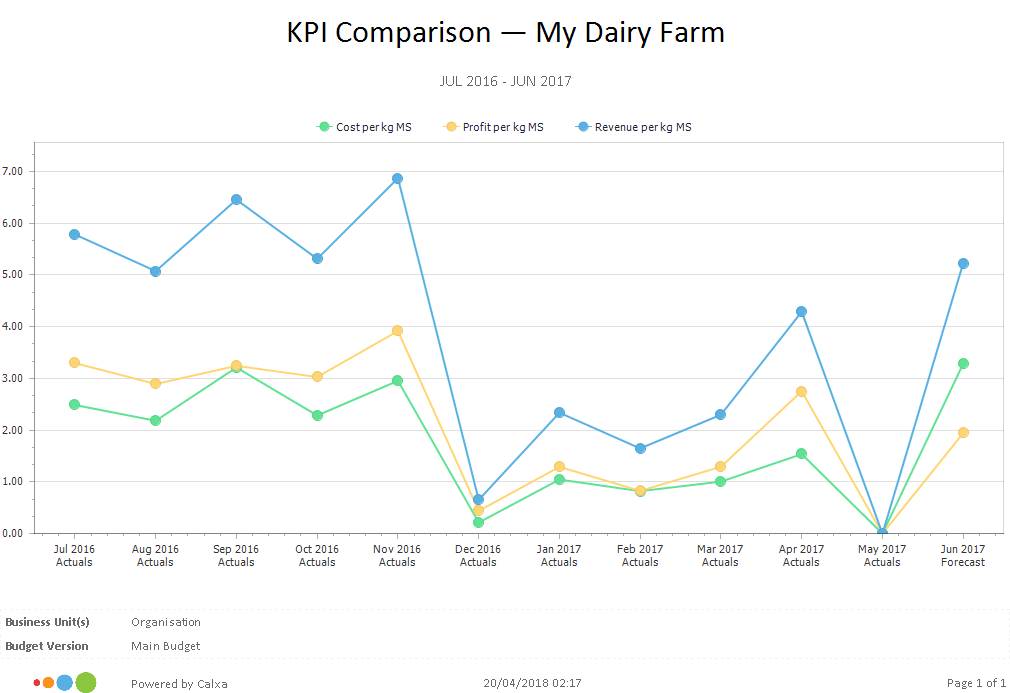
The KPI Spreadsheet Comparison chart is perfect for this scenario. You can plot the revenue, costs and profit KPIs together on the one chart. And, to make it even more valuable, it will show you actuals for completed months of the year, budgets for the remainder.

You’ll be able to clearly see the seasonal variations in your income, costs and profit. Wasn’t that simple? Now, you can easily add this to your Dairy Farmer Reports.
The Finishing Touch
For the final polish to your chart, add in an external benchmark. If you’re in New Zealand, Dairy NZ provide some numbers that will give you a guide to how other farm are doing. Simply add a metric and call it Kg Milk Solids/Cow Benchmark. Then, set the actuals and budget to the same amount each month (eg 398 for 2020-21). Now, make sure you record metrics for your milk solids production and number of cows. Then you create a KPI which would simply calculate your kg Milk Solids/Cow ([Kg Milk Solids Produced] / [Number of cows]) and add it in to your chart to see how your production compares to the industry average.
Now that you know how to create KPIs, find out how to prepare budgets while accounting for unpredictable natural hazards that may influence the performance of your agri-business. You can use the metrics you’ve created for your KPIs to work back the other way and set your budgets. The budget for your Kg Milk Solids Production could use a formula to multiply the benchmark per cow by the number of cows you have (or expect to have). Then your revenue account would be the production multiplied by the expected income per kg milk solids. This will complete your dairy farmer reports.
Information is the lifeblood of your business. Use it to understand what’s working and what you need to improve. Then, you will be on your way to carve out the success for your dairy farm that you work so hard for.
Happy farming.
