Many people find the Balance Sheet dark and mysterious. It’s something to leave to their accountant to worry about. However, it can tell you a lot about the health of your business. Doing a Balance Sheet Analysis using KPIs can help you to gain valuable insights. You’ll learn to appreciate the benefits of a balance sheet.
Balance Sheet Analysis Using KPIs
The benefit of a Balance Sheet Analysis using KPIs, is that you get simplified numbers. So, there’s less to focus on and less to get your head around. Many of these KPIs come standard in Calxa.
The Working Capital Ratio
Also known as the Current Ratio, this KPI compares your Current Assets to your Current Liabilities. Why is it important?
Because it’s a good indicator of potential short-term cash flow problems.
A value of less than 1 – so you have more current liabilities than assets – suggests you’ll have problems paying your bills on time.
A high ratio, say 5 or 6, isn’t necessarily a good thing either. That would depend on what the current assets were made up of. That’s where it pays to have a closer look at your Balance Sheet reports. It’s healthy to have a good cash reserve but if it’s mostly made up of inventory, it could indicate that you’re holding too much stock.
Similarly, if your current assets are mostly in Receivables, it could indicate that you’re not collecting payments efficiently. If this is a concern, review your Average Debtor Days (see below) as well.
You can find deeper explanation here including some examples on the Working Capital Ratio. As a result, you can use the suggestions to improve it.
Debt to Equity Ratio
This ratio shows how you’ve financed the growth of your business. This can be either from loans or investor financing. Investor financing in this context includes investment by the owner, as well as profits retained in the business. Higher ratios suggest you’ve been using debt to grow rather than equity. Incoming investors are often concerned by ratios in the range of 5 or more. To them, it increases the risk of the business having trouble repaying that debt in the future.
If you need bank finance at any time, they prefer to see at least some equity has been put into the business. If it’s in retained earnings, that’s even better as it indicates a history of profitable trading.
Average Debtor Days
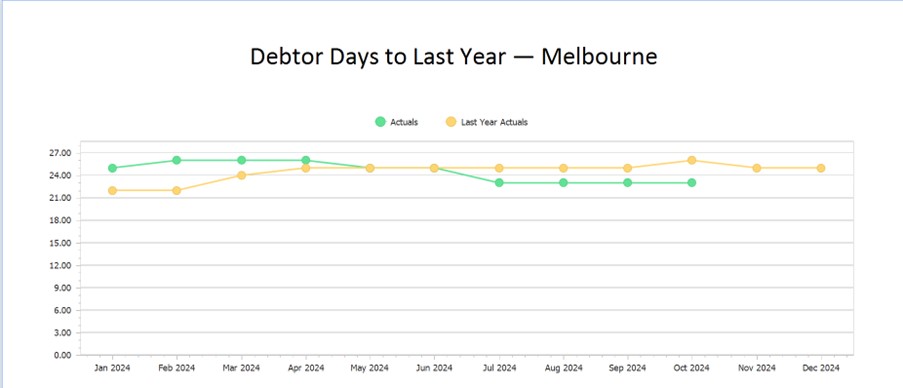
How soon do you collect payment on your invoices? What’s good and bad will depend very much on the industry you’re in and the type of sales you do. This is one of those Balance Sheet KPIs that benefits from monitoring as a trend over time. Ideally, as you improve your collection processes, you’ll see the number decrease.
Most of the major accounting systems now provide tools to help with collections, either built-in or through an add-on. If your average debtor days is higher than other businesses in your industry, review your terms and then your systems.

Average Creditor Days
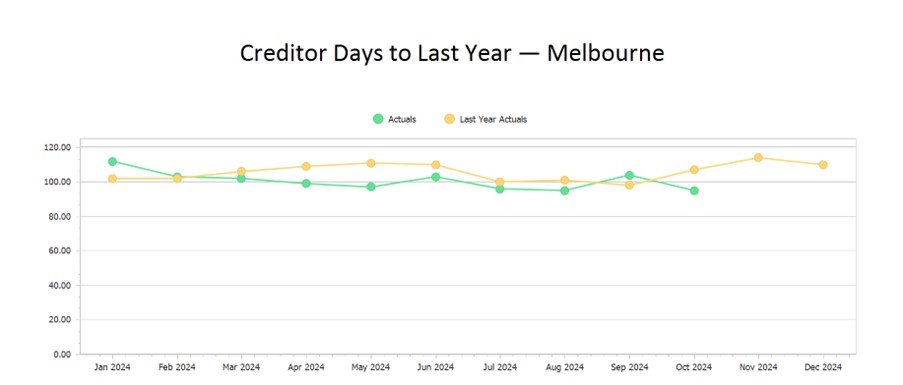
Like Debtor Days above, benchmarks for Average Creditor Days vary from industry to industry. Talk to your peers and find out what they are achieving. While a high number may be good for your short-term cashflow, it’s not so good for long-term relationships with your suppliers. Monitor this KPI monthly and watch out that it doesn’t creep up. This would indicate an early sign that you’re having cashflow difficulties.

Cash Balance
Many businesses manage their cash flow simply by monitoring the bank balance. On its own, that’s dangerous as it doesn’t tell you what’s coming in soon and what’s about to go out. Still, monitoring changes in the Cash Balance KPI will tell you what’s been happening, and highlight some trends. Use this KPI in conjunction with a Cash Flow Forecast chart. Add it to your bundle of reports and you’ll know about past and future.
Cash Reserves in Days
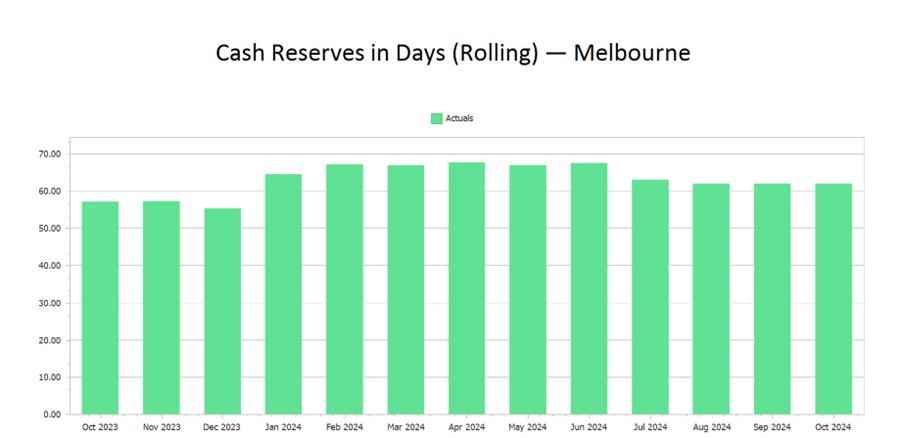
This important Balance Sheet KPI tells you how many days your business could last if your income suddenly dried up. While that extreme scenario is unlikely, fortunately for most businesses, it still gives a good indication of the strength of your cash position. It will tell you more than the Cash Balance itself.
This isn’t a default KPI but one you’ll need to build yourself using the KPI Editor available with Calxa Premier. To help you create it, use our guide Financial KPIs for Business. It explains in more detail the formula and how to go about it. It’s quite easy to create.
In an ideal world, reserves of 90 days are comfortable for any business. Anything less than 30 can increase your stress levels. The turmoil in many industries from pandemic lockdowns recently reinforced the need to build up reserves during whatever passes for good times in your business. Every dollar (or pound or euro) in the bank is one that could save you in a crisis.

Understanding your Balance Sheet
Using KPIs to analyse your Balance Sheet is a good entry point and you will be able to decide which of these numbers you need to monitor month by month. There will be some KPIs you can just look at periodically to make sure things are under control.
To deepen your understanding of the Balance Sheet and your knowledge of your business read part 1 of this series, Analysing the Balance Sheet. Better understanding your Balance Sheet will also help you with planning and budgeting. Have a look at our Making Sense of Balance Sheet Budget article.
Balance Sheets aren’t just for accountants! Everyone can gain valuable insights once they get over the fear.
