KPIs for Successful Retailers is an important topic. Retail is a very competitive business these days, so Key Performance Indicators (KPIs) play a strong part in your success. Here is our list of 7 KPIs for Retailers.
Your competitors aren’t just in the next town or suburb, they could be anywhere in the world. To survive and succeed in this environment you need to be very good at what you do. But how do you measure that and know you are doing well?
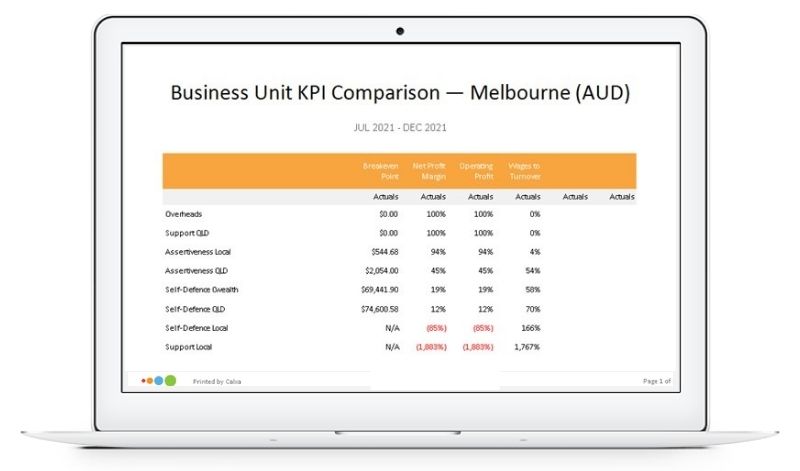
Our previous article Get Creative with KPIs gives you a good idea on how to integrate KPIs into your management reports. There are many metrics that help you run your retail business. So, here we cover some relevant KPIs, we think will be useful in measuring the performance of any retail store. While there are differences between selling shoes and selling bread, many of the core principles are the same.
Gross Profit Margin
Your gross margin tells you how much profit you’re making after deducting the direct costs of the goods you sell. Those direct costs are normally listed in the Cost of Goods section in your accounting system and will include not just the items you’ve sold but potentially freight costs to get them to you and any commission payments you make. This is one of the standard KPIs in Calxa but if you want to calculate it yourself, it’s simply:
Gross Profit/Total Income
Your gross profit margin will decline when you pay more for your products but don’t pass those increases on to your customers. A good strategy to improve your overall gross profit margin is to focus your sales effort on products with high margins. Sell more of them and you’ll improve this KPI rapidly.
Ideally, you will know the gross profit margin on each product you sell. Position the high-margin products where your customers will find them easily and reward your staff for promoting them.
Net Profit Margin
Often referred to as the bottom line, this is your profit after deducting all expenses from your Gross Profit – all the rent, salaries, fees and other expenses that are necessary to carry on a retail business. This is the first number that any potential buyer of your business will want to know and it’s the one that tells you how much of your earnings can eventually land in your own pocket. The formula for the Net Profit Margin is again a simple one:
Net Profit/Total Income
Amazon may manage for many years without making a profit but most of us will run out of cash very quickly if our expenses exceed our income.

Sales per Square Metre
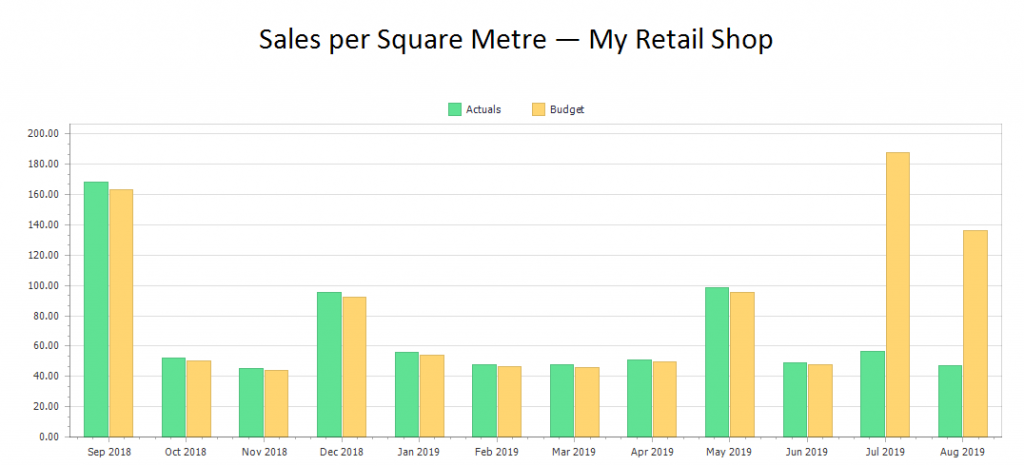
This is a commonly used metric to compare different shops and different locations. It tells you how well you are utilising the space you have. If you’re part of a franchise group or industry association, they should be able to help you with benchmarks – or just ask colleagues in similar shops. It is important to compare like with like. For example, a jeweller is likely to have a very different result to a garden centre, but they could both learn from comparison to similar retailers.
You’ll need to know the area of your shop and then the formula is simply:
Total Sales/Shop Area
In Calxa, add a Metric for your Shop Area (setting the calculation type to End or Average so it doesn’t accumulate when you run a multi-period report) and then use this formula in the KPI Builder.

Sales per Employee
How productive is your team? How do you measure that over time? Keeping track of sales per employee not only allows you to measure overall performance, it gives you a good guide to when it makes sense to hire the next person. Some retailers include all staff (including those in the back office) in this metric, others prefer to just include those with direct customer contact. This means you do need to be careful when comparing from one store to another, but as long as you are consistent within your own store, it’s a good way of measuring performance. The formula is simple again:
Total Income/Number of employees
In Calxa, add a Metric for your Employee Number (setting the calculation type to Average so it doesn’t accumulate when you run a multi-period report) and then use this formula in the KPI Builder.
Average Transaction Value
There are 2 ways to increase your sales in a retail environment:
- Get more customers
- Or, sell more to existing customers.
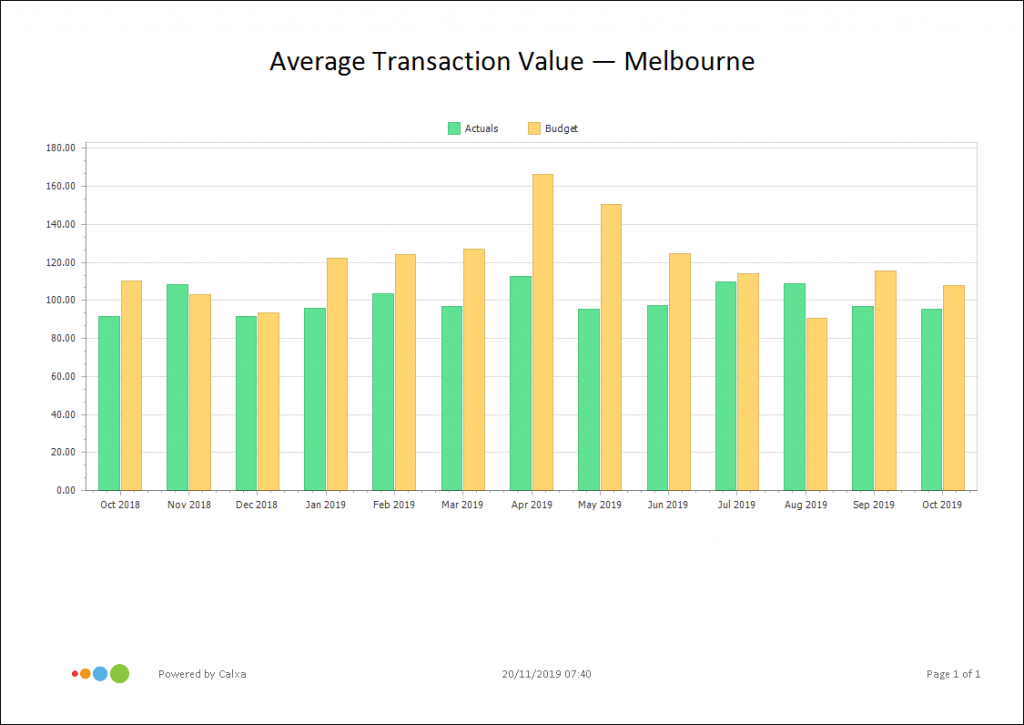
Keeping track of your average transaction value will tell you how good your staff are at selling more to existing customers. This is a very insightful KPI for retailers of all sizes. Training and encouraging more sales to existing customers is often a better investment than marketing for new customers. The formula is:
Total Income/Number of Transactions
Any decent point of sale system should provide you with the total number of transactions for a time period. Even most manual cash registers would do that as long as you recorded it daily! Create a Metric in Calxa and then use that as the basis of your KPI.

Inventory Turnover Days
One of the biggest dangers in retail is to accumulate stock. There’s an optimum level of inventory that you need to satisfy your customers and ensure you don’t run out. If you have more than that, you’re tying up cash that could be better used elsewhere. Sometimes stock levels increase because you start to accumulate products that aren’t selling quickly (and that’s the time it may make sense to discount them); sometimes it’s because you’ve been unable to refuse a bulk-buy bargain from one of your suppliers. Those bargains make sense if the price discount is greater than the cost of holding the stock for a longer time.
Inventory/Annual Cost of Sales x 365
In Calxa, we use the Annual Cost of Sales (for the preceding 12 months) to give you a rolling KPI that isn’t distorted by good or bad trading months. It’s one of the standard KPIs so you just need to select it!
Visitor Conversion Rate
If you’re investing in an online presence, then it’s important to measure the return on your investment.
On a website, Google Analytics will tell you how many visitors you’ve had for the past week or month and it’s easy to then compare that to the number of customers or sales you had and measure the effectiveness of your website in converting those visitors. How effective is your physical shop at converting visitors? It’s simple these days to install sensors that will silently count how many people come into your shop each day. You can then compare that to the transaction count from your Point of Sale system to see how many of those visitors you convert to sales.
Total Visitors/Total Transactions
To set up this retail KPI in Calxa, simply create the 2 Metrics and a formula to compare them. When bench-marking your results with your peers, be sure to compare similar retail outlets to yours. Once you have this KPI in place you can then monitor monthly and see how it improves as you train your staff to greet customers more warmly or as you adjust the layout and flow of the store.
Final Thoughts
KPIs are the crux of retailers that want to build a successful business. KPIs for successful retailers, like all KPIs are there to provide a guide to what’s working and what’s not. They are your fuel gauge giving you an immediate feel of where your business is at. Here are some additional resources for other industries:
- Financial KPIs for Business – A Calxa Guide
- KPIs for Farmers
- Metrics and KPIs for Hospitality
- Importance of KPIs for Not for Profit Organisations
Use KPIs to make better-informed decisions on what will improve your business.
