
Business Key Performance Indicators (KPIs) are the numbers that keep you informed on what’s happening in your business. They’re rarely useful in isolation but if you watch them over time, they will help you see how your business is tracking. In addition, they will give you advance warning that there are problems ahead. We’ve picked our Top 3 Business Key Performance Indicators that you may find relevant to your organisation.
Business Metrics and KPIs
These 3 Business Key Performance Indicators are financial metrics that will help you manage your business. These business metrics and KPIs will measure your business performance. With little effort they help you stay on track.
All 3 Financial KPIs play an important role. They are different in their nature and used in combination magnify their importance:
- Bring attention to very focused areas of your business at a given point in time. They give a snapshot and often refer to an area where a downturn or upturn can have a big impact on your business.
- Highlight core parts of your business. These are traditional accounting-based indicators that measure a financial value.
- Provide important survival gauges that are sensitive to monthly changes.
Top 3 Business Key Performance Indicators
Here are out 3 top business Key Performance Indicators to measure your business performance. We think your business should look at these monthly.
1. Wages to Turnover
Hiring people is expensive but they are vital for most businesses. Especially in a service business, having the right people in place can make the difference between success and failure. The Wages to Turnover KPI shows you your wages costs as a percentage of your income. Often, it’s not the absolute cost of wages that’s a problem, it’s when it is not aligned with your income.
If you hire additional sales staff, your Wages to Turnover KPI may increase in the short term. As those staff become productive and start selling, it should return to normal levels. If your new sales staff are more productive than the previous team, this KPI will ideally return to something lower than previously.
Because it’s important to so many people, we’ve included Wages to Turnover as one of the standard financial KPIs in Calxa. In the KPI Account Group editor, you can modify the definition of the Wages group. It starts from the accounts you’ve nominated in the Wages and the Superannuation sections of the Cashflow Settings. But you can add other accounts too.
Some people like to include accruals for Annual Leave, Long Service Leave and so on. Define the Wages costs the way that makes sense to you. The important thing is to be consistent, so you are reporting the same thing from one month to the next.
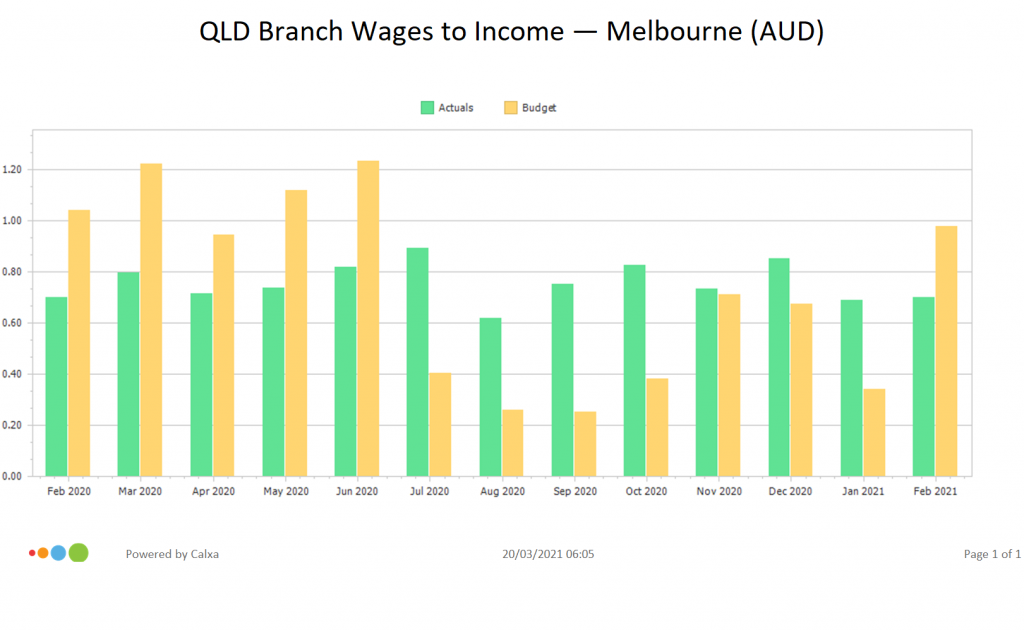
This example here is a great way of using the Wages to Turnover KPI for not-for-profits. It isolates the performance of a single program or activity.
Tip: If you use the KPI Analysis Bar Chart (Multi-Period) you have great flexibility over your dates. In this example, it shows the last 13 months so you can compare the previous year and see the trends in between.
2. Gross Profit Margin
The Gross Profit Margin is one of the core accounting ratios. It shows the proportion of your income that is returned as profit, after deducting direct costs. Depending on your industry, those direct costs may be termed Cost of Goods Sold or simply Cost of Sales.
Deducting the direct costs from revenue gives you your Gross Profit in monetary terms. Dividing this by the total income gives you the Gross Profit Margin.
The inverse of Gross Profit Margin is the Cost of Sales Percentage. That takes the direct costs and divides them by the total income.
A Gross Profit Margin of 40% is the equivalent of a Cost of Sales Percentage of 60%.
Which business metric and KPI you use doesn’t really matter. In some industries (such as hospitality) it’s more common to refer to the Cost of Sales Percentage. In other industries such as retail, it’s more common to use the Gross Profit Margin.
Talk to your peers about what financial metrics they are using for their small business. Keep in mind, you’ll find it easier to compare to other businesses in your field.
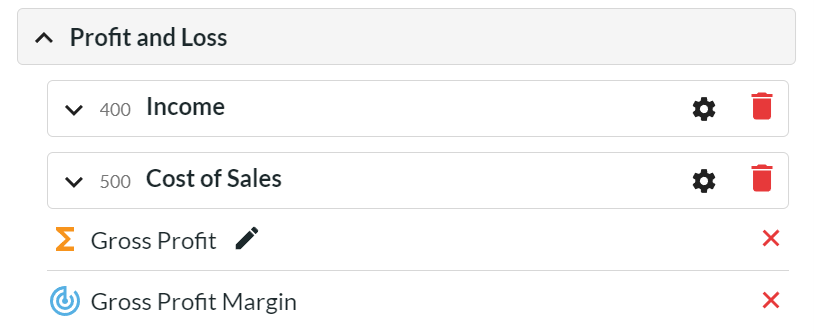
With our 3rd generation Account Trees, you can incorporate this KPI directly into a P&L report, beneath the Gross Profit amount. Seeing the amount and the percentage together gives you an instant, clear understanding of your performance.
3. Cash Reserves
How many days could your business survive if there was a sudden drop in income? Knowing this financial KPI gives you a good idea of how stable or fragile your business is. The key to calculating this is to estimate your daily expenses, excluding the non-cash ones. Calxa has a default Account Group for Annual Expense which gives the annual movement on all your expenses. Create a similar group (set as Annual Movement) for items like depreciation that should be excluded.
In the Balance Sheet section there’s a standard Account Group for Default Bank which includes the bank accounts nominated in Cashflow Settings. You have the option of adding extra accounts here such as a savings or investment account.
The Cash Reserves KPI formula is then simply:
[Cash Reserves]/(([Annual Expense]-[Non Cash Expenses])/365))
Add this to one of the KPI charts and you’ll be able to track it month by month.
In an ideal world, 90 days cash reserves is comfortable. The reality is that many small businesses survive on much less. It can be done but it’s hard and you need to constantly monitor your cashflow.
Importance of Business Key Performance Indicators
Using these 3 Business Key Performance Indicators, will give every business a good start. Know these numbers and you’ll understand your business better. Here are some additional examples. Business Key Performance Indicators look slightly different from one industry to another. Here are other KPI examples:
KPIs for your Bookkeeping Firm
10 Examples of KPIs for Travel Agency Managers
To get started with these KPIs, check out our Financial KPI for Business Guide or watch this webinar recording KPI Tips, Tricks and Metrics.