
KPIs for cash management provide businesses with a quick way of monitoring availability of cash. Generally, cash flow problems rarely appear overnight. In most businesses, they build quietly—through slower customer payments, rising costs, or subtle changes in working capital that go unnoticed until the bank balance starts to fall.
That’s why cash management KPIs are so important. While a cash flow forecast is the best tool for predicting what’s likely to happen next, the right KPIs provide early warning signals about pressure building inside your business. They help you spot trends, test assumptions, and take corrective action before cash becomes a crisis.
In this article, we outline seven important business KPIs for cash management that every organisation should monitor. Together, these metrics give business owners, finance teams, and boards a clearer picture of liquidity, collection efficiency, and how quickly the business converts activity into cash.
7 Important KPIs for Cash Management
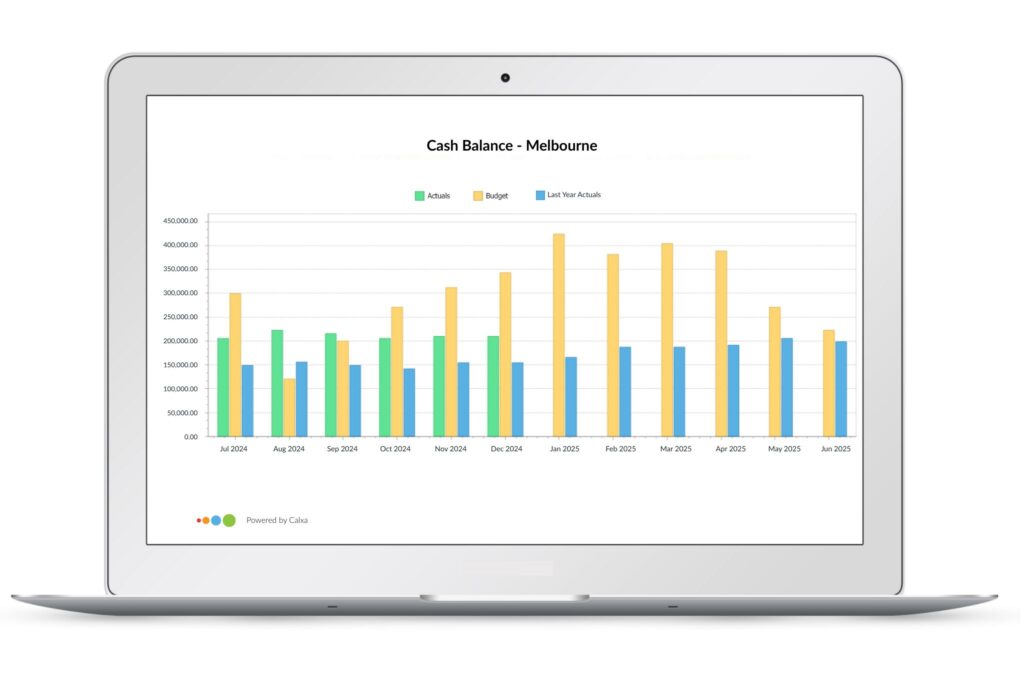
1. Cash Balance
It may sound obvious but don’t overlook the obvious! If your bank balance is trending downwards over time, you need to understand why. Many businesses have seasonal ups and downs and that’s perfectly normal . So, compare to the previous year as well as the last few months and watch for steeper or longer declines than normal.
Cash Balance is a default KPI in Calxa so available to everyone. It’s based on the bank accounts nominated in your Cashflow Settings. To make this easy, you can edit the Account Group and add or remove accounts to suit your needs.
Watch out for:
- Declines lasting longer than a normal seasonal dip
- Month-end balances regularly below forecast
2. Debtor Days & Creditor Days
How good is your collection process and are you letting it slide? When you’re busy working in the business, it’s easy to take your eyes of some of the less immediate tasks, especially when you think you have good systems in place. Be alert for a lengthening of the Debtor Days KPI as it suggests your customers aren’t paying you as quickly as they should and that’s going to affect your bank balance in the future.
While stretching out your payment terms can be beneficial for your cash balance in the short term, you should be wary of doing so at the expense of supplier relationships. Always talk to your suppliers if you’re having difficulty paying. And if you’re having difficulty paying your suppliers, it’s a sign to look at the underlying causes of that. Is it something temporary or does your business have long-term funding problems? Consider getting advice before you slip into insolvency.
Watch out for:
- Increasing debtor days due to slow customer payments
- Changes to creditor days that are masking short-term cashflow issues
3. The Cash Conversion Cycle
This KPI measures how long it takes you to convert the goods you buy into cash. It adds your Inventory Days (how long you hold stock) to your Debtor Days (how long your customers take to pay you) and deducts your Creditor Days (how long you take to pay your suppliers).
Inventory Days + Debtor Days – Creditor Days
The aim is to minimise the first two (sell stock quickly and collect the cash quickly) while maximising Creditor Days (again, within the terms that maintain good relationships with your suppliers). A business that gets paid in cash before ordering goods, could have a negative Cash Conversion Cycle. This is great in the short term as your suppliers are effectively funding your growth – but be careful that you are building reserves to be able to pay those suppliers eventually.
You can easily create this KPI yourself as the underlying components (Inventory Days, Debtor Days and Creditor Days) are in-built KPIs. Build your Cash Conversion Cycle KPI by selecting the other KPIs and getting the right operators between them.
Watch out for:
- Lengthening of the cycle can be a sign you need to evaluate slow-moving stock
- Sudden, unexpected changes can be a sign of changing customer behaviour
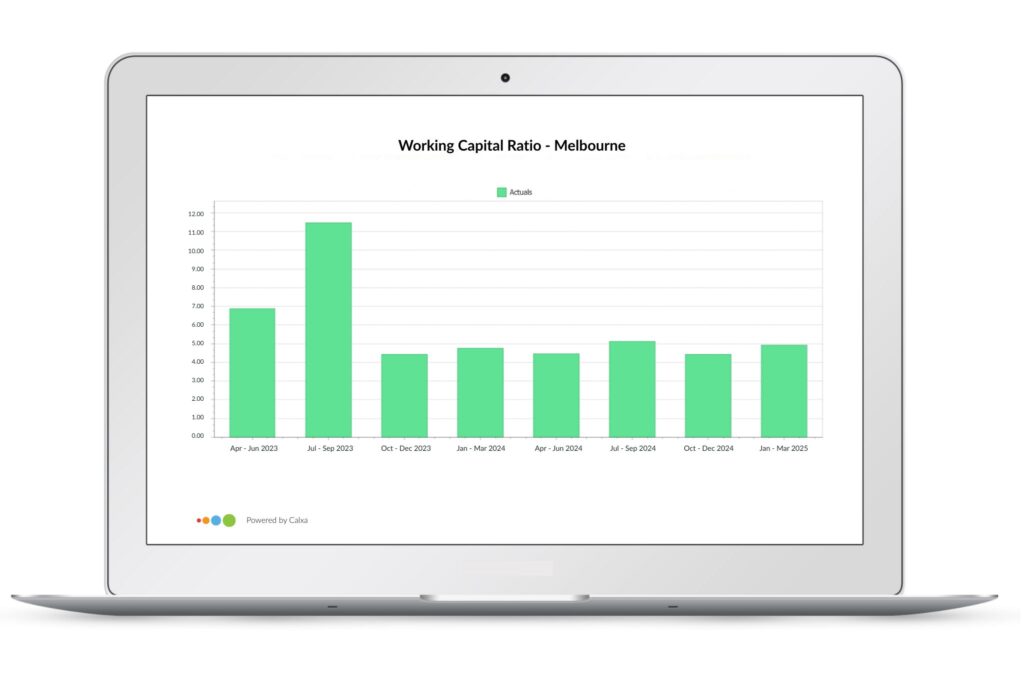
4. Working Capital Ratio
The Working Capital Ratio compares your Current Assets (those things you own that could be converted to cash reasonably quickly) with your Current Liabilities (what you owe that is due in the next 12 months). A value of less than 1 (sometimes expressed as 100%) is considered a sign of a risky business. It says that for every dollar you owe, you have less than a dollar in assets and that’s a sign you could have trouble paying. Maybe not today but next month or in a few months if things don’t improve.
Watch out for:
- Seasonal declines that last longer than usual
- A consistent downward trend that can be an early warning of cashflow problems
5. Cash Reserves in Days
This is a measure of how long your organisation could survive if cash dried up tomorrow. It takes your average daily expenses (excluding non-cash items like depreciation) and compares that to your current bank balances.
This is an important KPI to monitor for upcoming months as well as past behaviour as it will give you early warning of impending cashflow issues.
Watch out for:
- Declines over time that indicate reserves are being used for working capital
- Predicted declines below your comfort level (90 days is often regarded as best practice)
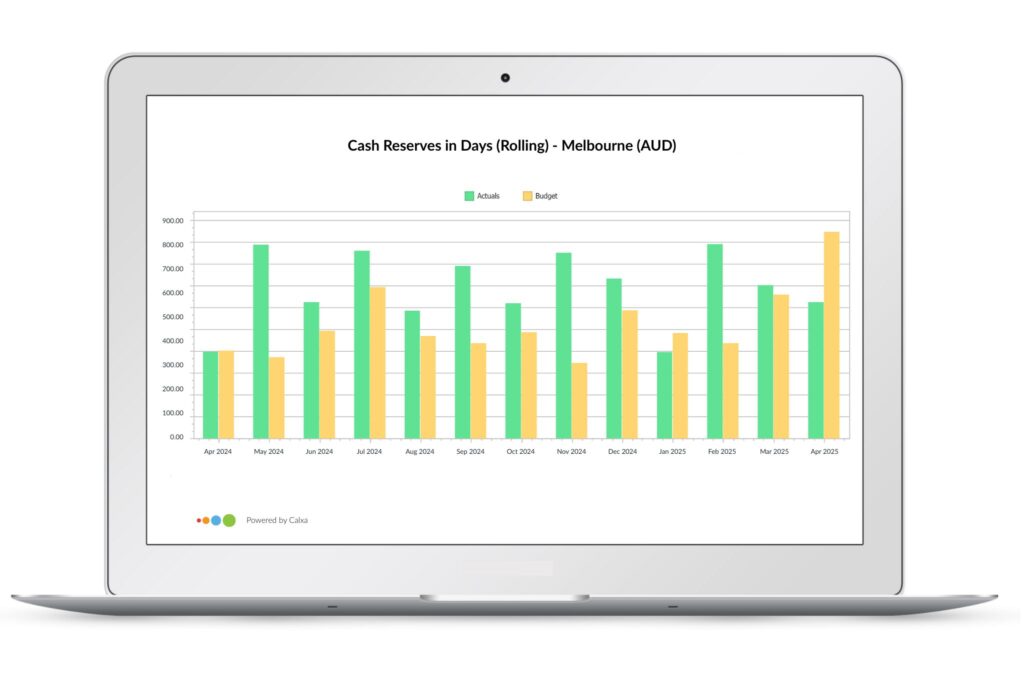
Cash Reserves/Average Daily Expenses
If you have more than 90 days reserves you are in a comfortable position and should be able to withstand short-term shocks to your business. While income completely drying up is an extreme case, it does happen in natural disaster incidents or global pandemics. And there are also the less extreme cases where you lose just one major customer. It may not be as severe as everything drying up but it will strain your business without those reserves. This number is arguably one of the more important KPIs for cash management.
Watch this video for a quick overview of how to create it.
6. Operating Cashflow
The idea with Operating Cashflow is to look at the cash that is being generated by your business each month. Start with the Net Profit figure, add back non-cash items like depreciation and then add in changes in working capital. This considers your collections and any increases or decreases in what you owe to suppliers. The Operating Cashflow KPI is often used by investors and potential buyers of a business (sometimes excluding the owner’s wages too) to measure how much cash the business is generating each period.
Net Profit + Non-Cash Expenses + Change in Working Capital
Watch out for:
- Unexpected declines are an early warning of profitability or cashflow issues
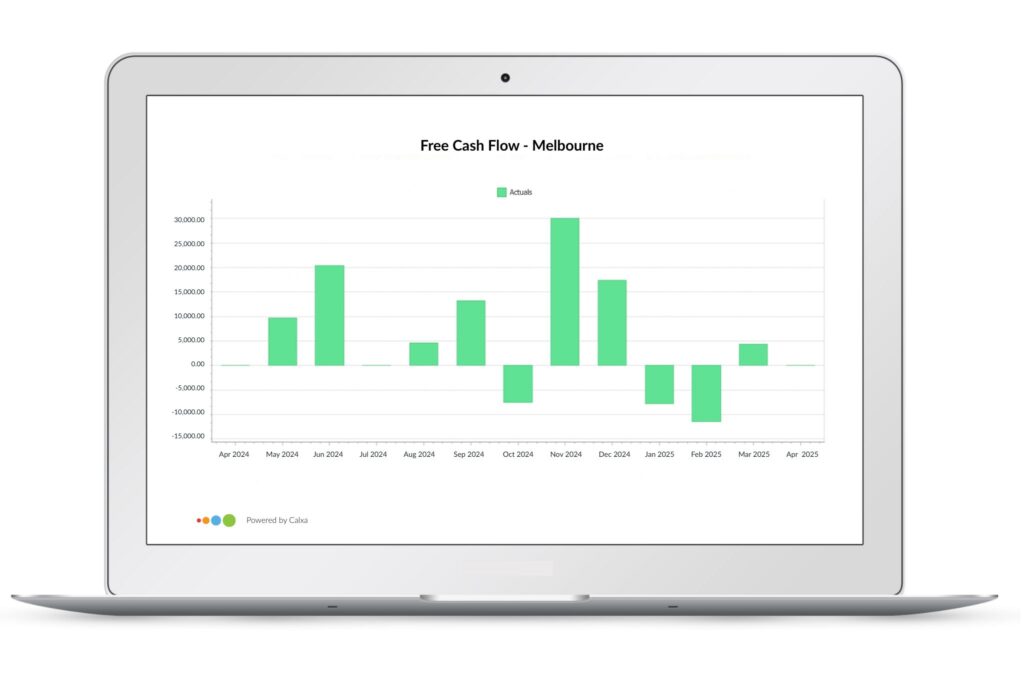
7. Free Cash Flow
Free Cash Flow expands on the Operating Cashflow concept by also excluding interest payments (which are considered a finance cost) and including asset purchases. Like most KPIs, it’s the trend that is most useful in analysing whether a particular value is ‘good’ or ‘bad’. If the Free Cash Flow generated by a business is declining over time, that suggests underlying problems that aren’t yet showing up in profitability. Be aware though, that because Free Cash Flow includes capital purchases, it can be subject to big variations when those purchases occur.
Watch out for:
- The effect of future asset purchases that may want longer term financing to minimise short-term risk
- A declining trend in the businesses ability to generate cash can threaten long-term survival
Operating Cashflow + Interest – Capital Expenditure
KPIs for Cash Management
Managing cash effectively isn’t about watching your bank balance alone. It’s about understanding why it’s changing and what will happen next.
These seven cash management KPIs give you visibility into the drivers of cash flow—how quickly customers pay, how long cash is tied up in operations, and whether working capital pressure is building beneath the surface. When reviewed regularly, they act as an early warning system, highlighting issues while there’s still time to respond.
Used alongside a rolling cash flow forecast, these KPIs help you move from reactive cash management to informed decision‑making. Instead of being surprised by cash shortages, you can anticipate them, test scenarios, and take action with confidence.
If cash is critical to your business—as it is for most—tracking the right KPIs is one of the simplest ways to stay in control.
Here are a couple of articles to help you along:
To get started, follow our KPI Guide and watch this KPIs for Cash Management Webinar Recording.