Preparing branch performance reports can be challenging for businesses and their advisors. There are many issues to consider, from legal to financial and more. Calxa can simplify and automate the reporting to help measure branch performance.
Company Branch or Subsidiary?
The first consideration goes to the corporate set up. This article what’s the difference between a branch and a subsidiary explains the corporate set up required. It is important to understand the underlying accounting system structure. In other words, this will set the foundations on how to prepare the management reports.
For instance, your company branches can be set up as separate legal entities with their own accounting data. Alternatively, they could be cost centres within the one accounting system.
The Branch Performance Reports
Here are some suggested branch performance reports to give you deeper insights into your group. When we refer to Business Units in Calxa, they could be separate organisations or they could be cost centres within one company file (Tracking Categories in Xero, Jobs or Categories in MYOB, Classes, Jobs or Locations in QuickBooks).
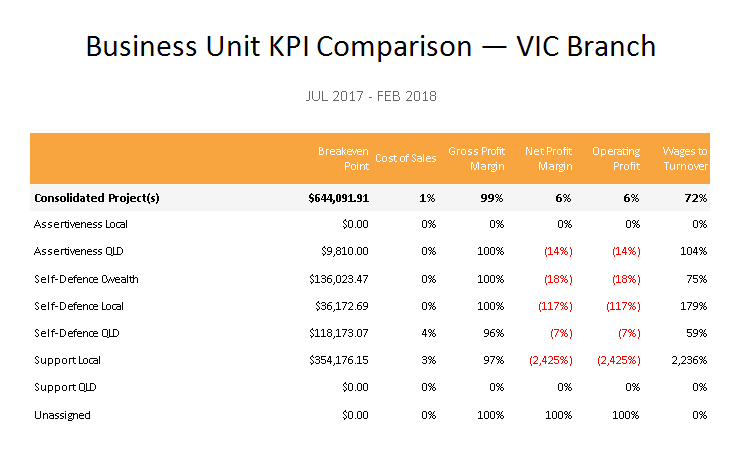
Business Unit KPI Comparison
KPIs are great for measuring the performance of your business. This is why Calxa has long provided the ability to report on business units with KPIs. Here are a couple of ideas on how to apply KPIs for Businesses. Have a read of these articles 7 KPIs for Retailers and KPIs and Metrics for Hospitality. We’ve recently added this new report to list all your business units on one page with a selection of KPIs. This makes it really simple to compare KPIs across your branches.
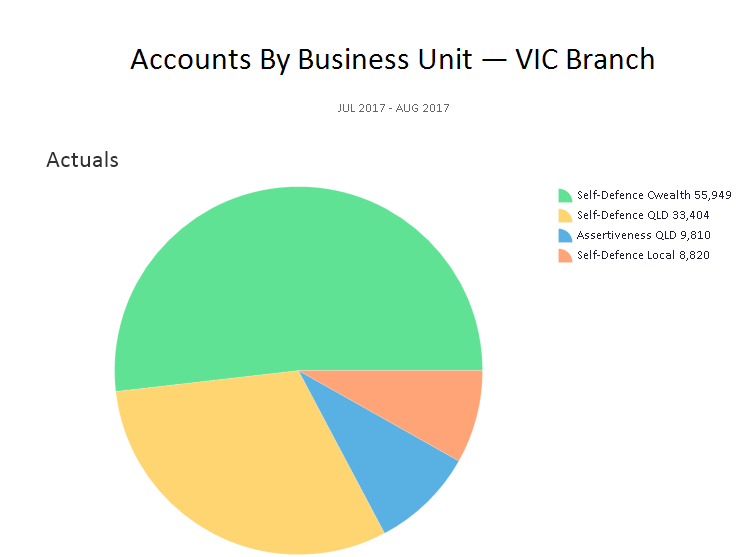
Accounts by Business Unit
Sometimes you want to see things visually and this chart breaks down your expenses, income or any account for each of your branches.
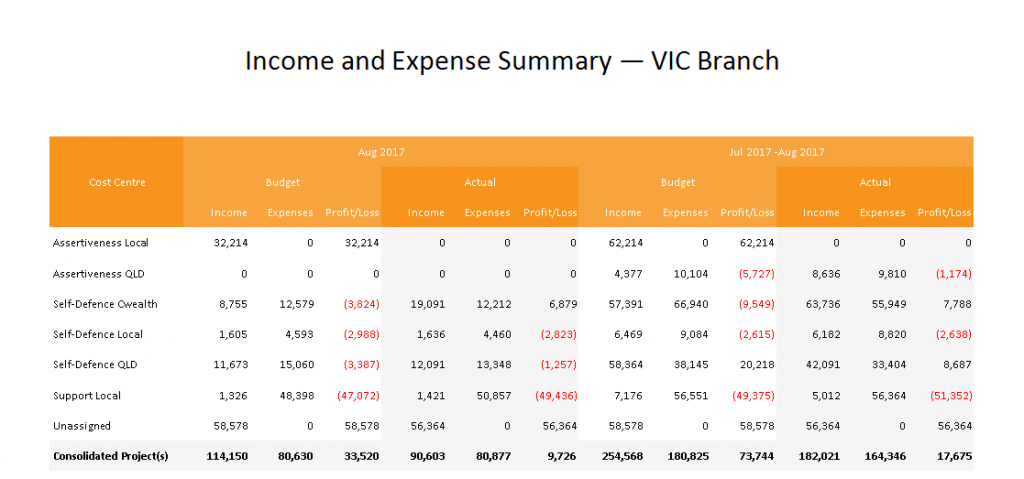
Income and Expense Summary
While you often need a detailed Profit & Loss report for each branch, there are times when you just need the overview. Senior management and directors may only ever need the overview (unless there’s a problem). Use this report to get the big picture of what’s happening to your branches.
Multi-period KPI Chart
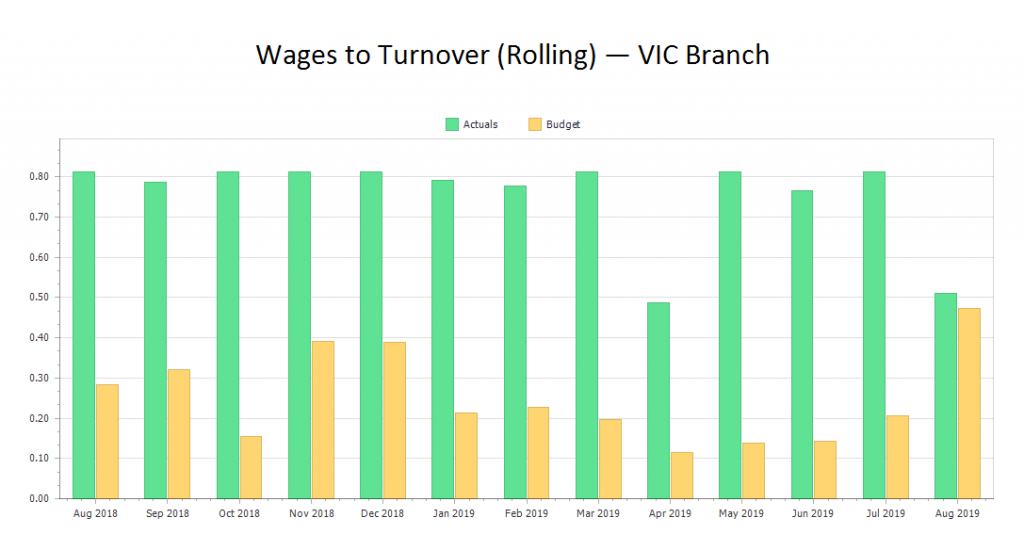
Don’t restrict your reporting to a financial year. That works well for your accountant and tax purposes, but it doesn’t always give you what you need for management reporting. In Calxa many of the reports and charts will run across a financial year and have flexibility in the date range. As an example, this chart covers the previous 13 months so you can get a comparison to the same month last year as well as tracking the trend movements.
Reports to Measure Branch Performance
Reports on good branch performance can help identify what practices work well. At the same time, recognising negative activities is equally valuable. It is important to understand how each company branch is running.
As well as this selection of charts, have a look at our Top Reports for Multi-Company Consolidations. Most of the reports that work for consolidating different companies also work for consolidating cost centres within a company.
If you want to have a go at doing your own KPIs for your company branches, watch this webinar recording KPI Tips, Tricks and Metrics.
