Do you need multi-company consolidation reports? Calxa gives you a way to do just that. Until you’ve tried it in Calxa, consolidating reports for several companies can be quite daunting and time consuming. On top of that, it’s sometimes challenging to know what reports will be needed. To help you, we’ve identified 7 top reports that will provide you a clearer picture of your organisation’s accounts to simplify the consolidation process.
Multi-Company Consolidation Reports with One Click
Before we get started, remember that almost every report in Calxa works with a consolidated organisation group, but these will give you extra value. You’re probably wondering how you can access these reports on a regular basis. Within Calxa, you can easily build a bundle of reports and then add a workflow to schedule delivery every month. Alternatively, you have the option to run your bundle at the click of a button.
To start out, you will find the best consolidation reports and a couple more by navigating to Reports, then Builder. On the left side, under Calxa recommends, you’ll find the Consolidation section.
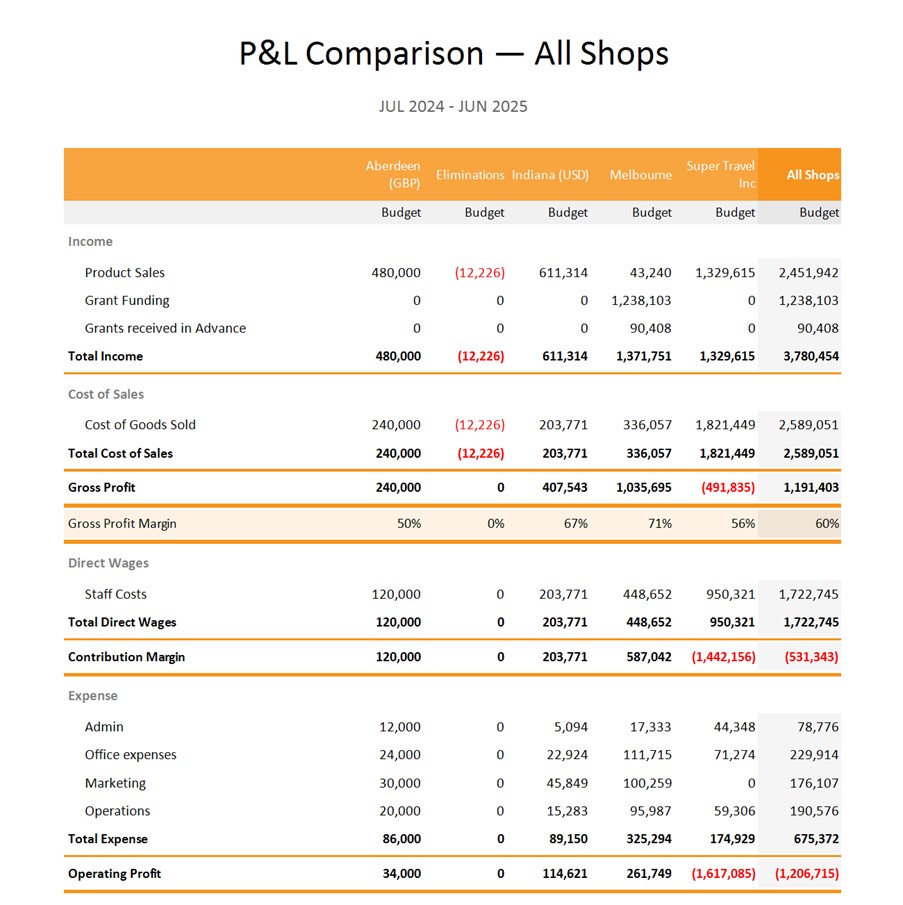
1. P&L Comparison
Sometimes the easiest way to compare your companies is to view them side-by-side. This report allows you to compare multiple companies across many columns. See each company side-by-side with a total to show the whole picture of the multi-company consolidation.
This report is also great for troubleshooting. When you’re not sure where the numbers are coming from in your consolidated reports, this will give you the breakdown by company:
- Display Actuals for a date range, set Using Actuals Up To to the end date of your report.
- Show budgets, set Using Actuals Up To to the month before the start date.
- Report on a forecast (actuals to date, budgets for future months), set Using Actuals Up To to the report month and the end date to something after that (like the last month of the financial year).
If you would prefer your report to be less detailed, use Account Trees to group, summarise and re-order your accounts while maintaining the integrity of your report.
2. Balance Sheet Comparison
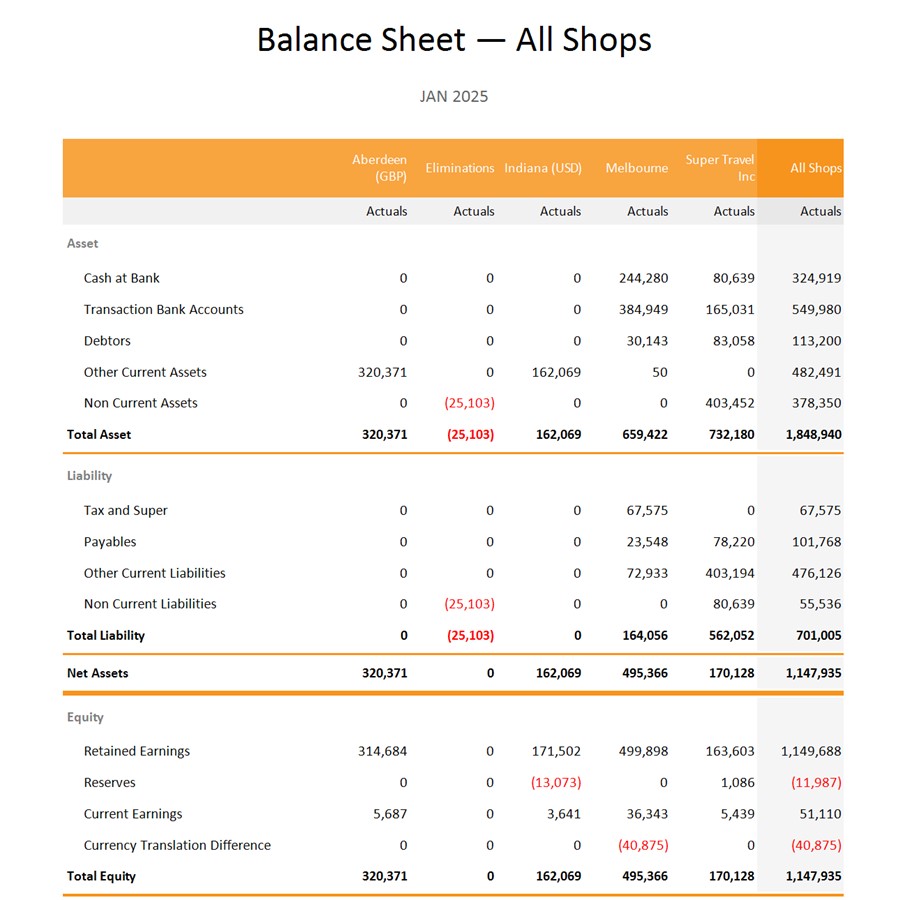
As with the profit and loss above, the simplest way to compare your companies is to look at them side-by-side. Especially for non-accountants, this gives context to the balance sheet figures, allowing you to compare one entity to another.
If your inter-company elimination account(s) are in the balance sheet, this report will help you troubleshoot any discrepancies. You will see which entities have positive amounts, which negative ones. Also, when you’re using an Account Tree for your consolidation, you probably normally have the elimination header set to Summary Only. For troubleshooting purposes, turn off Summary Only to view the detailed accounts being eliminated.
3. Business Unit Income & Expense Summary
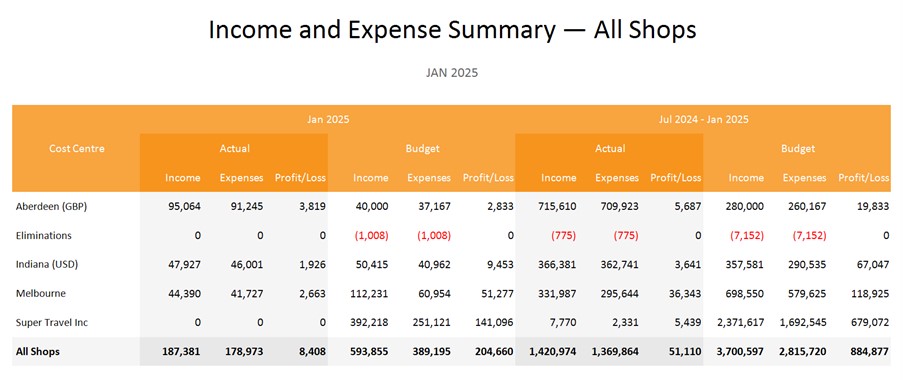
It is important to be aware which of your entities are profitable and which areas need addressing. You can use the Business Unit Income & Expense Summary to give you a simplified list of organisations (one line each). This report is a great way to get an overview of your multi-entity consolidations when you don’t want a detailed Profit & Loss report for each company.
The Report Designer gives many options on the columns you can add and offers alternative display modes.
4. Cashflow Forecast
Cashflow is crucial to success. Forecasting cashflow allows your organisation to examine different scenarios and evaluate the effects of cashflow. This feature simplifies the decision-making process (especially for anyone who isn’t an accountant). Spreadsheeting a multi-company consolidated cash flow forecast is probably one of the more time-consuming tasks you’ll come across. You will find it so much easier with Calxa.
Once you’ve been through the cashflow setup process (P&L budget, Balance Sheet budget and Cashflow Settings) in each company, go to Report Bundles, Create New Bundle to generate a full 3-way forecast for your group.
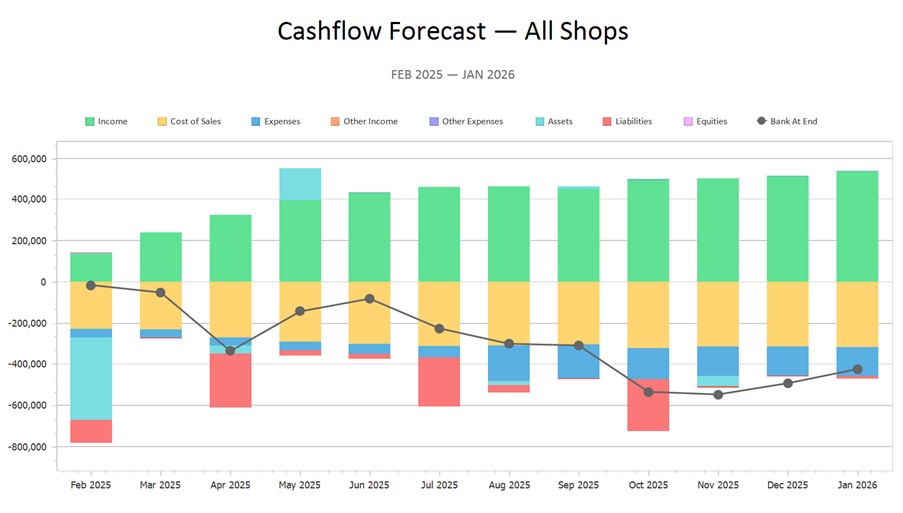
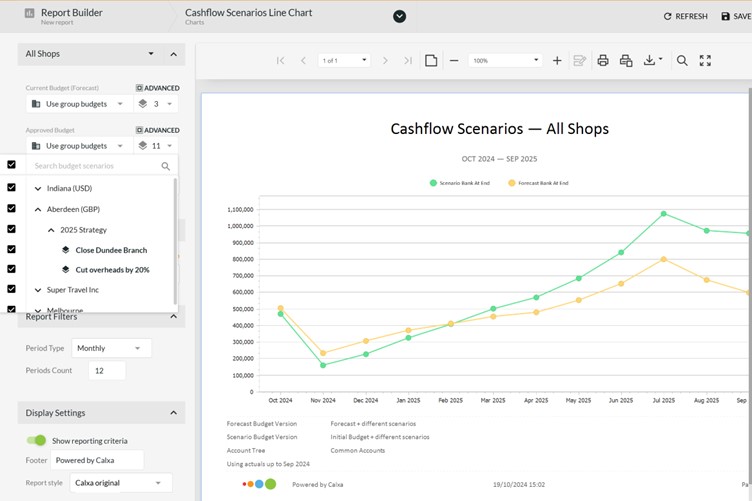
Once you have created your first forecast, build on it with scenarios to explore the effects of different strategies on your cashflow. A report like the Cashflow Scenarios Line Chart makes it easy to compare the effect of different combinations.
5. Comparing Actuals to Budgets
Budgets are important at all levels and in Calxa we build them from the ground up:
- From your cost centres or business units in each organisation
- Then you can report on them at the consolidated group level.
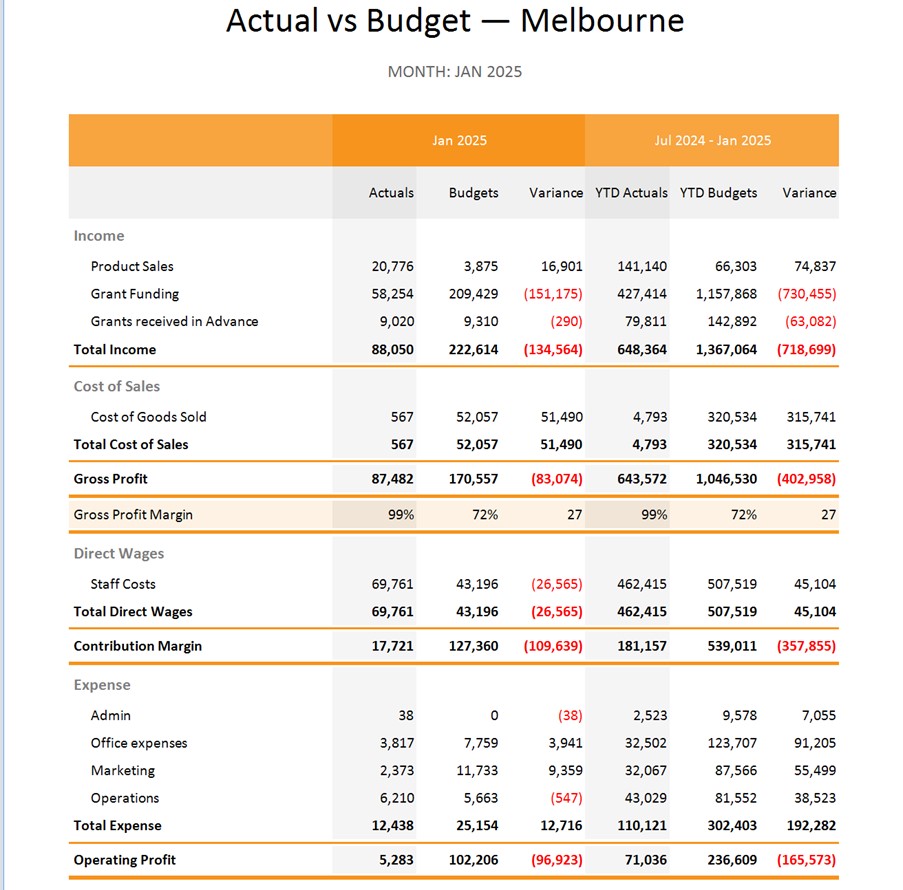
Calxa has many reports to compare actuals to budgets in different ways and all can be run at any of these levels. Measure your performance to budget by project, department, company or any selection of companies. If you have a 40-entity group, Calxa gives you the power to report in many ways:
- On one company,
- The whole group,
- Or ,any subsection of the group.
You can optimise the reports to display KPIs: these reports can include built-in KPIs as well as any you have customised.
6. Ranking by KPIs
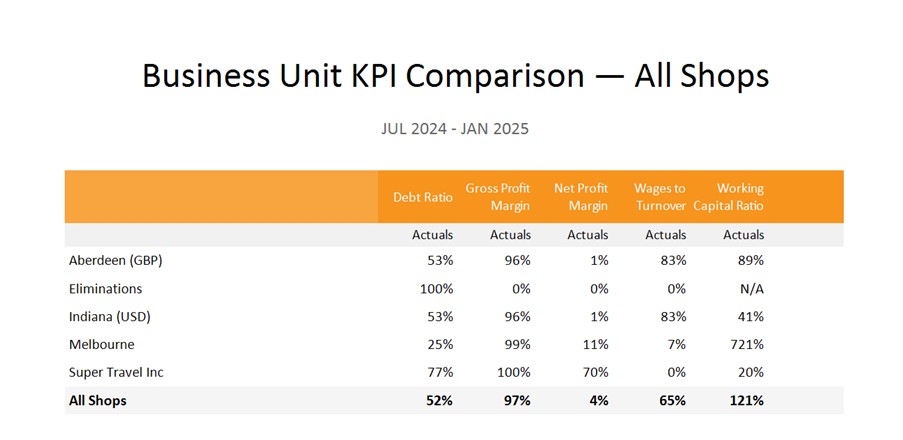
KPIs in Calxa can be traditional ratios, or they can be numbers. Report the Gross Profit Percentage, the Bank Balance or the Total Revenue. Any of these can be represented by a KPI and then used on the Business Unit KPI Comparison Report. What’s more, you can sort the report by any of the KPIs so you can show your most profitable, or the one with the highest revenue, at the top.
7. Bank Movement Waterfall Chart
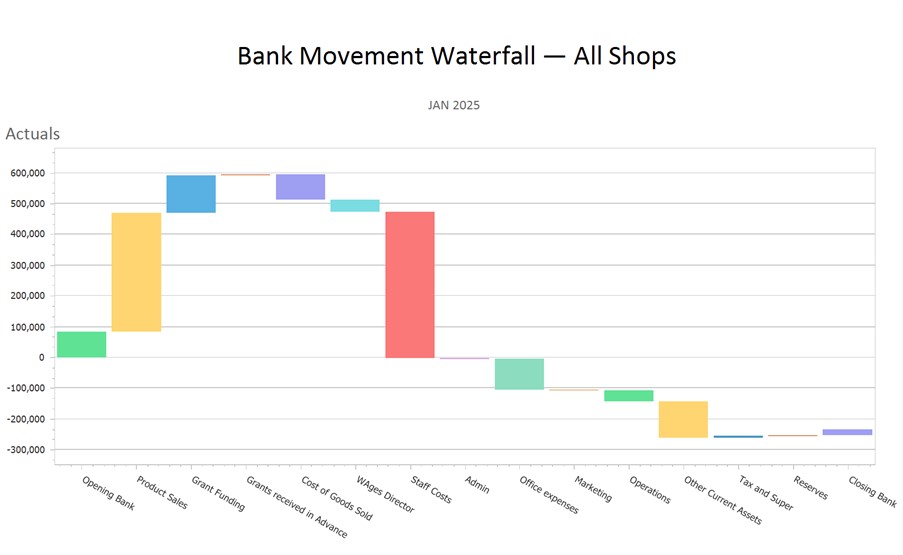
Business owners and managers love to see the movement of funds through the business and the Bank Movement Waterfall Chart is a great way to do just that. The chart visually represents the cumulative effect of the positive and negative movements of your bank balance. Run at different levels, using Account Trees to group your accounts, to get a clear view of what’s driving your group.
8. Detailed Consolidated Reports
OK, so this one isn’t a report, it’s the Report Bundle. By simply adding the individual reports into a Report Bundle, you have an automated multi-entity consolidation report. This can be done with any report in Calxa, from financial statements to budget comparisons, to balance sheet or cashflow forecasts. Then use a workflow to schedule delivery to your email as required.
Getting Started with Multi-Company Consolidations
So there you have the 8 reports (well, 7 reports and 1 Report Bundle) we recommend for anyone creating reports for multi-company consolidations. They can provide you with the insights you need to analyse your companies’ financial performance and make informed decisions for the future. Multi-entity consolidations can be tricky. Account Trees in Calxa are the key to creating a common reporting structure across all entities. Read this article 7 Uses for Account Trees to better understand how this works in Calxa. To find out more on how Calxa can help your group consolidations start with our multi-branch enterprises page. Or, use our Group Consolidation Guide to start saving time with multi-company consolidation reports.
