by marketing@calxa.com | 16/05/2018
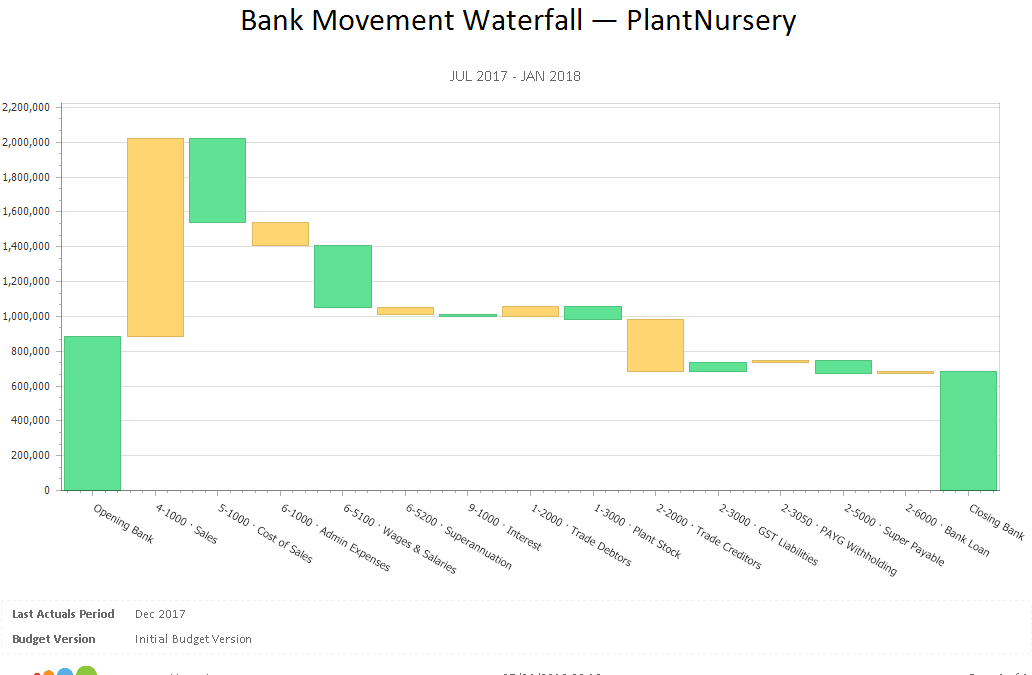
This chart visually represents the cumulative effect of the positive and negative movements on your bank balance. Each bar starts at the position the previous bar finished thus showing the cumulative effect of the inflows and outflows.
by marketing@calxa.com | 16/05/2018
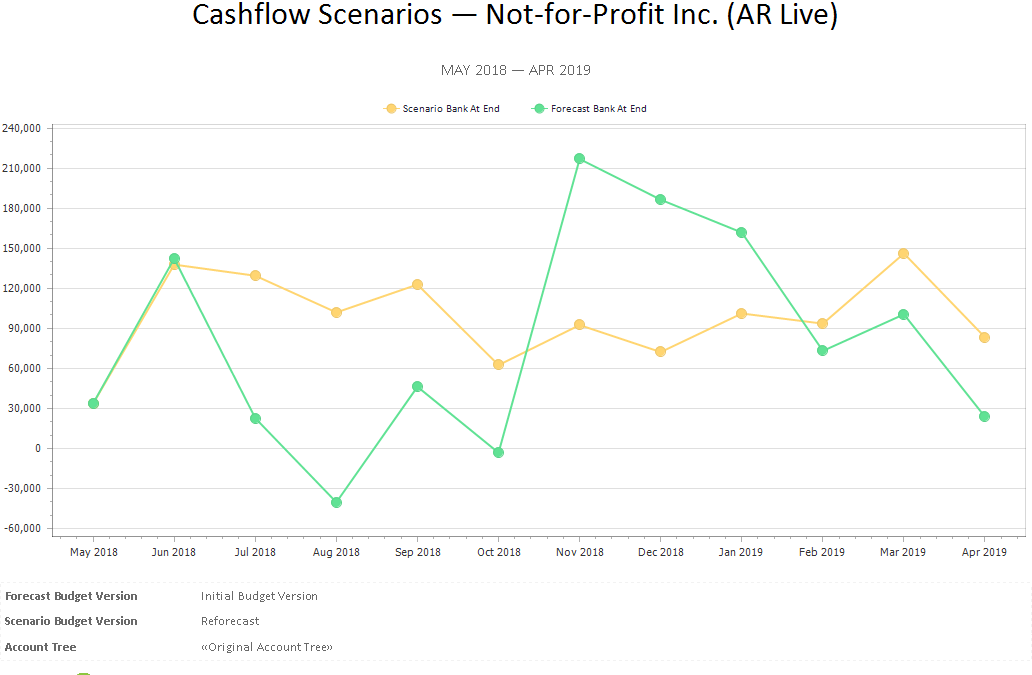
A great planning tool, the cashflow scenario can easily compare ‘best case’ with ‘worst case’ highlighting what needs to be achieved to reach set goals.
by marketing@calxa.com | 16/05/2018
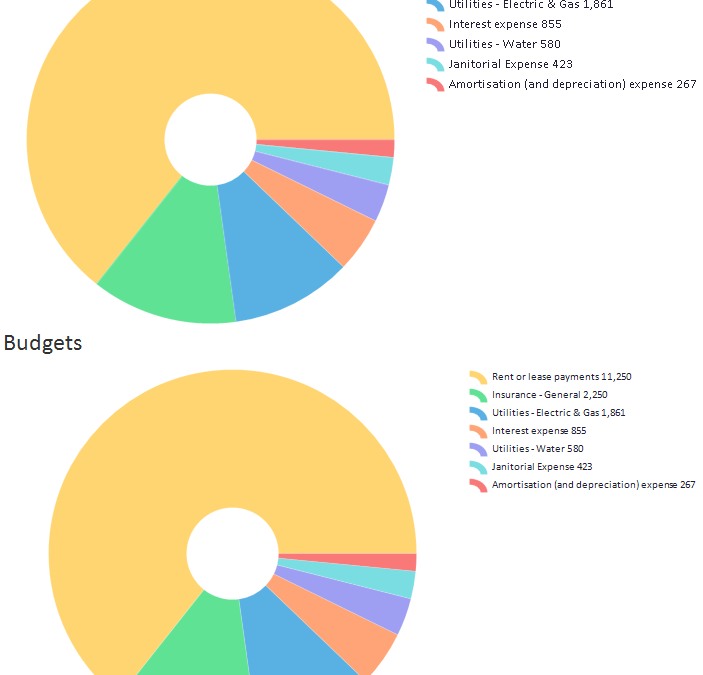
See clearly which expense lines are contributing most to your total costs. This is a great report to really understand spending and allocate resources.