Group consolidation reporting, also referred to as multi-company consolidation, can be a time-consuming task for any CFO (Chief Financial Officer). Often, it involves a plethora of spreadsheets with multiple interconnecting worksheets. The effort you need to keep this environment balanced and reconciled is agony for many. It can fall over just by overriding one formula. And, sometimes, you may not even notice the error until months down the track.
The desired outcome is the ability to see several business activities wrapped up into a combined financial statement. This gives a view across all companies and can be used to track the overall performance.
Often, there are times when your business needs to go beyond its initial structure and end up with more than one entity. For example, you could have several reasons you want to separate these activities from your original company:
- Entering a business venture where you only have partial ownership.
- Setting up a new business in another country that trades under different tax legislation and a different currency.
- Growing a branch network where each branch is responsible for their own business. Maybe each trades under different state/region laws.
This guide details the steps you need to take to configure Calxa for easy way of reporting across multiple companies.
Table of Contents
- Who needs group consolidation reporting?
- What are group consolidations?
- Calxa’s group consolidation reporting
- Terminology used in Calxa
- Consolidation by accounting system
- Reporting year end
- Account structure across the group
- Multi-currency consolidation
- Partial ownership
- Eliminating inter-company accounts
- Reporting on consolidated groups
- Summarising multi companies in a group
- Reporting by department in a group
- Learn more
Who Needs Group Consolidation Reporting?
It is not always big business that needs group consolidations. There are many scenarios where a group consolidation would be beneficial like:
- Owning a small business that comprises a company and a family trust
- Being the CFO of a multi-national with global reach
- Managing a multi-branch group of companies
- Creating a franchise group that needs to report on the whole group or separate regions.
Whatever the circumstances, it is important to be able to consolidate the different parts of your empire and view it as a whole.
What Are Group Consolidations?
First and foremost, the purpose of Group Consolidation is to give you that birds-eye view of the group.
It needs to be a complete 360-degree perspective.
You will want to look forward with cash flow forecasts and balance sheet forecasts. In addition, you will need to look back to compare actuals to budgets and measure performance with KPIs. As a result, sometimes you will want summary information and charts to get a quick view of what is happening. At other times, you will need to dive into the detail.
Calxa’s Group Consolidation Reporting
Calxa’s consolidated group reporting gives you all of this. It works the same, whether you are working with 2 entities or 200. Once set up, you can automate the extraction of core data from your accounting systems and the delivery of reports to your stakeholders.
Terminology used in Calxa
To start off, before getting to the how-to, get familiar with the terms used by Calxa:
- Organisation is the generic term we use to cover companies, trusts, sole traders. Essentially, it’s a connection to one accounting data source, usually one legal entity and could be a manually imported company.
- Business Unit is the expression we use for divisions within an organisation. They might be departments, projects or cost centres. In your accounting system they could be Tracking Category Options (Xero), Classes, Locations or Customers (QuickBooks) or Jobs or Categories in MYOB.
- Workspace is a container for your organisations. To consolidate a group of companies, they must be in the same workspace. Most people manage perfectly well with all their organisations in just one workspace. However, for those of you who are accountants in practice dealing with dozens or hundreds of clients, workspaces can be a useful way to group and separate them.
- Organisation Currency is the currency used in your accounting file and is automatically recognised when you connect.
- Base Currency is set for each workspace. All exchange rates are set against this currency.
- Reporting Currency you can set for each Consolidated Group. To report in an alternate currency, simply create a copy of the group and change the reporting currency.
Consolidation By Accounting System
Many groups have a uniform accounting system used by every company. Often, this is paired with a standard chart of accounts. However, while that can simplify things, it is not essential when reporting with Calxa. Whether you are using Xero, QuickBooks or MYOB, Calxa will connect to any of them and bring the data together. However, if you are using another accounting system, create a manual organisation and import your data each month.
Differences in the charts of accounts can be easily managed with Calxa’s Account Trees. Create a common Account Tree structure with the headers and running totals you need for your reporting and then use it across all the organisations.
Once the data has been brought into Calxa from your accounting system, there are only minor differences in behaviour between them.
Reporting Year End
Because each country has different accounting rules, it sometimes happens that the year-end closing date is different in some entities in the group. For this reason, Calxa handles that by giving you the option to set the reporting year end for the Consolidated Group.
Tip: Make use of this feature when you want to report on a project, even if it’s in just one company, that has a different start and end date to your organisation. Add the organisation to a consolidated group (it will happily ‘consolidate’ just one). Set the Reporting Year End to the end of your project and then you’ll be able to run Year to Date reports on that timeframe.
Account Structure across your Group
Differences in the charts of accounts can be easily managed with Calxa’s Account Trees. Create a common Account Tree structure with the headers and running totals you need for your reporting and include all the organisations. Furthermore, if the chart of accounts is identical you can automatically allocate detail accounts simultaneously to the same header. However, if there are accounts with a different format (or name and number) you simply drag them to the right header.
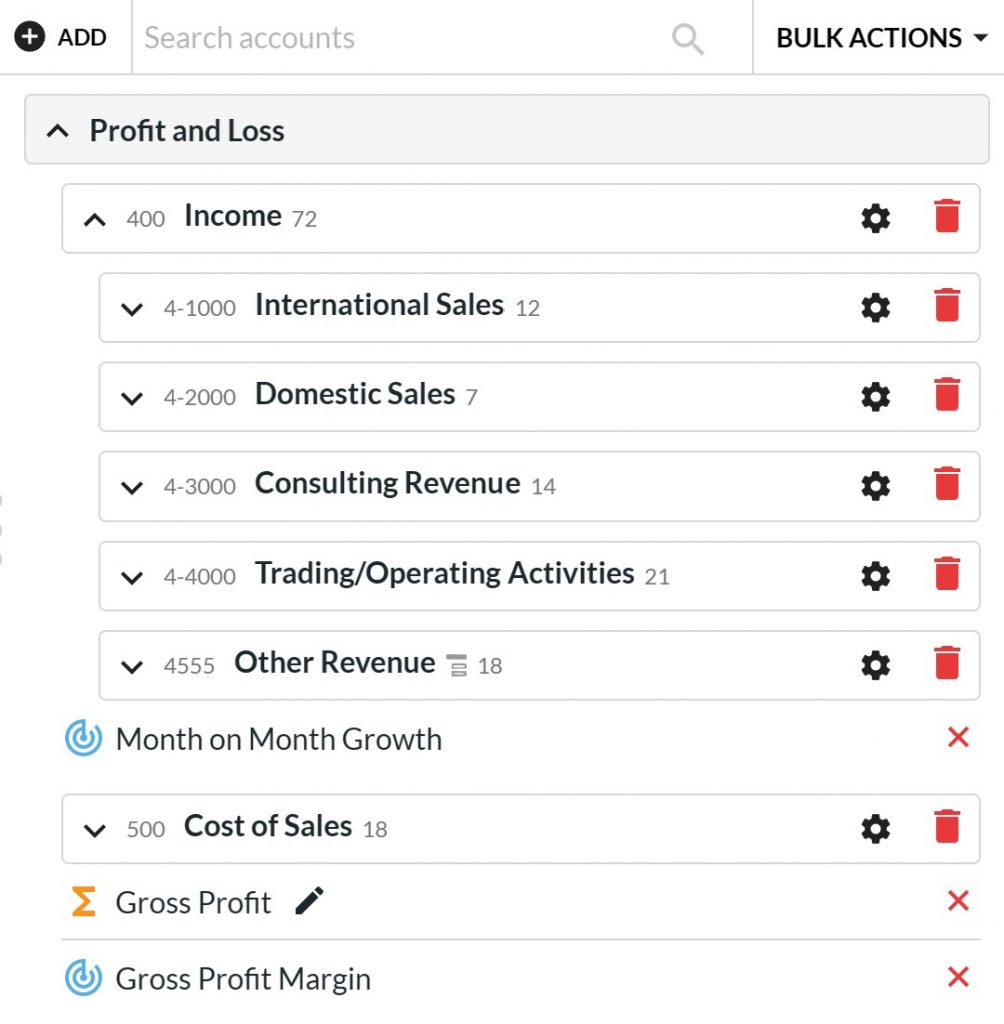
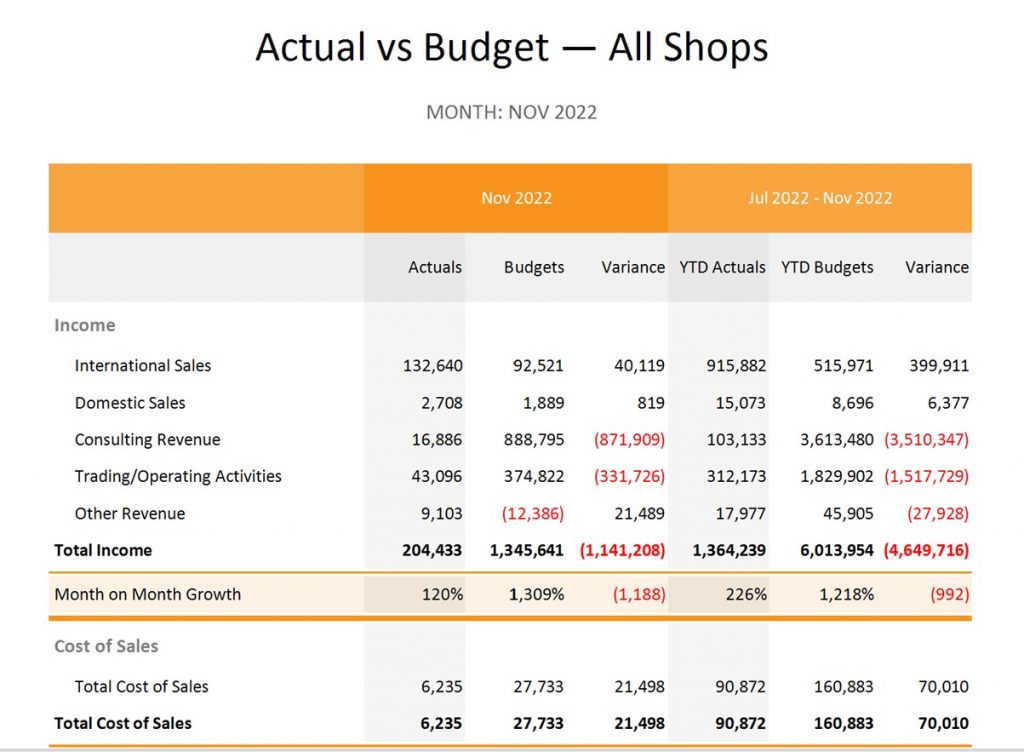
Your header structure can be customised to suit the summary level you need for your consolidated reporting. In addition, Account Trees have flexible totals and the option to add KPI rows.
Multi-Currency Consolidation
When dealing with entities in different countries using different currencies, it is important to get the accounting aspects of multi-currency reporting correct.
Calxa imports rates for 170+ currencies so you do not have to manually enter historical rates.
However, where your rates vary, you have the flexibility of amending them. Whether your individual companies use 1, 2 or 10 different currencies, Calxa will give you the ability to manage rates for both period movements and closing balances.
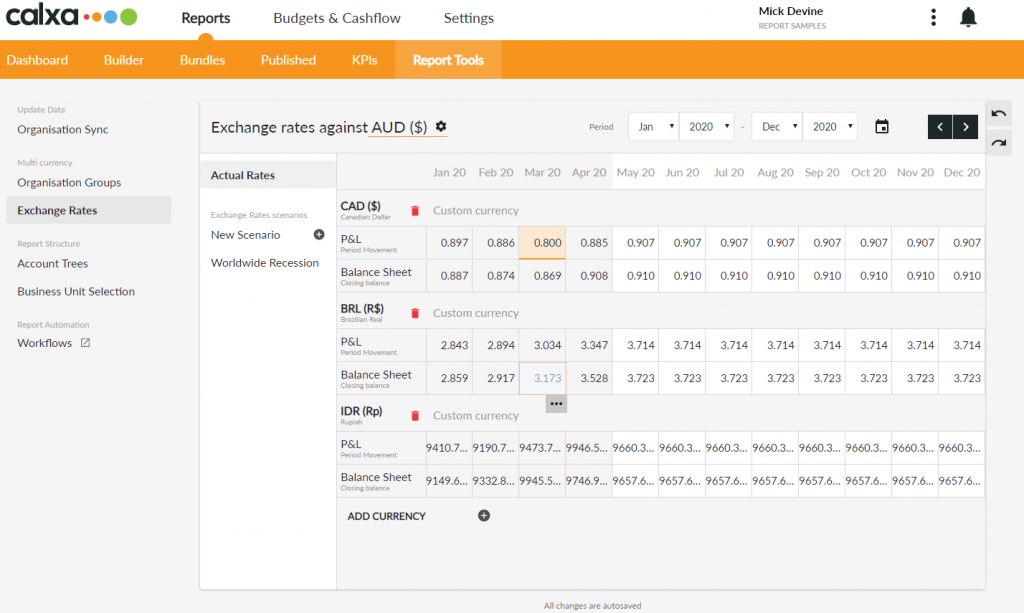
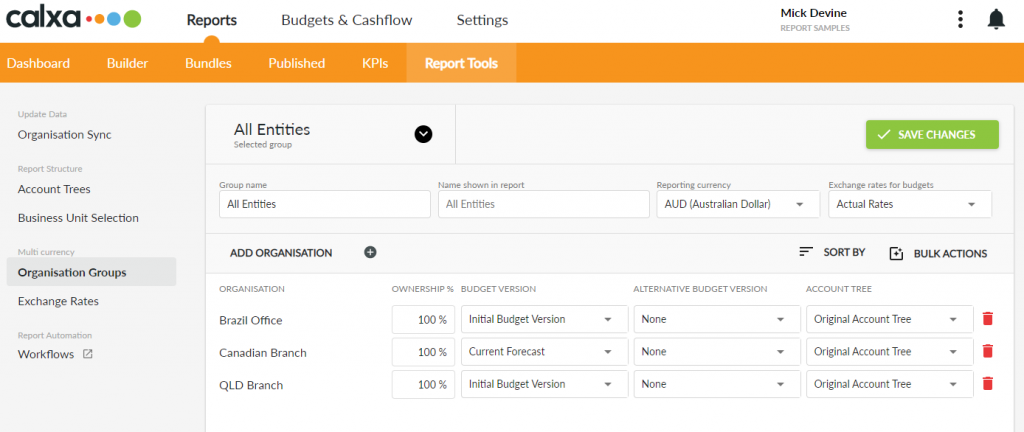
Regardless of the base currency of each organisation, you have the option of reporting in any currency. For example, you could have one company in Canadian Dollars (CAD), one in Brazilian Real (BRL) and one in Australian Dollars (AUD) and then report on any of those currencies or something completely different such as US Dollars (USD).
Use Exchange Rate Scenarios to forecast possible changes in future exchange rates. By default, we will assume that the latest rate will continue unchanged when you’re reporting for future months. You can though, create a scenario to see the effect of an appreciation or depreciation of any of your main currencies.
Once you’ve created the scenario you can select it in your Consolidated Group and see what effect that has your future cashflow.
Partial Ownership In A Group Consolidation
If you do not own every entity in the consolidation group outright, there are times when you only want to report on your interest in the group. You can do this simply in Calxa by setting the ownership rate for each entity within a consolidated group. For example, you can have one consolidated group showing the total group interests and another showing just the partial ownership.
Eliminating Inter-Company Accounts
It is important to exclude inter-company transactions when consolidating your group accounts so that you get a true view of the group results. Calxa offers 2 methods of doing this, depending on how your accounts are structured.
Eliminating Entire Accounts
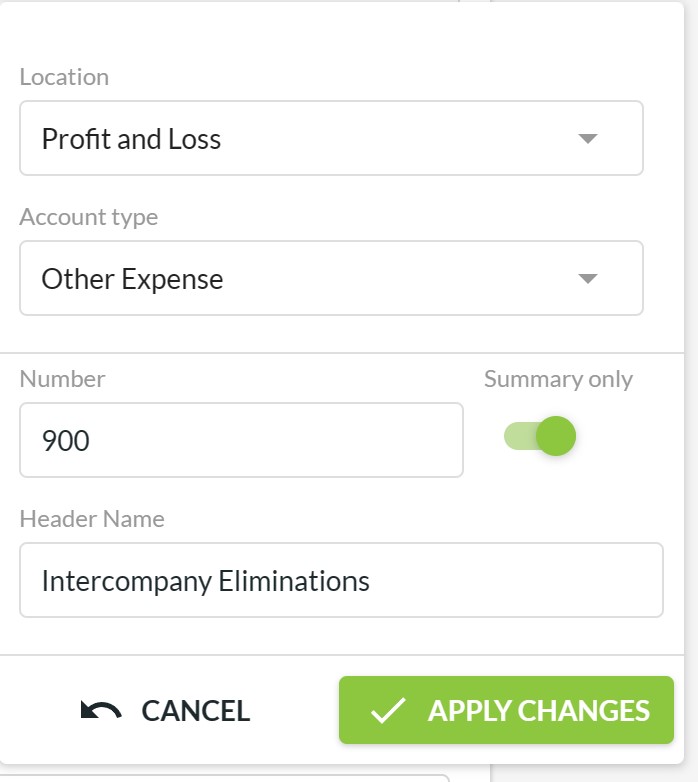
If you split up inter-company transactions into separate accounts (a separate account for inter-company sales and cost of sales, for example), you can use Account Trees to remove those accounts from your consolidated reports. Simply create a new Header set to Summary Only and drag the accounts to be eliminated onto that Header. For more details have a look at our 7 uses for Advanced Account Trees.
Partial Eliminations
Where you need to partially eliminate accounts, the steps are different. You process the elimination entries in a separate organisation and include that in the consolidated group. This is much as you would do with a manual, paper-based elimination journal. The other organisation could use the same accounting system as your main companies. Or, you could create an organisation manually within Calxa and enter the elimination amounts for budgets and actuals in that.
Whichever method you choose, you will be able to easily identify the elimination entries in your consolidated reports and ensure they balance.
Keeping Eliminations Simple
If you want to make your eliminations as easy as possible, follow these practices in your accounting system:
- Have separate Income, Cost of Sales and Expense accounts for inter-company transactions. Don’t mix them with external transactions.
- Have a separate loan account for each entity.
- Pay inter-company invoices at the end of each month, either through the bank or through the loan accounts. Leaving them in your Debtors or Creditors accounts will complicate your reporting.
- Reconcile the inter-company loan accounts each month.
Reporting On Consolidated Groups
All Calxa’s report templates – except where it does not make sense – support multi-company consolidation. Here we will highlight some key reports that make for good management reporting. Our blog Top Reports for Multi-Company Consolidations will show you some further examples of what you can achieve with Calxa. Even the transaction reports work across companies.
Consolidated 3-Way Forecast
A full 3-way forecast or 3 Statement Model is an essential part of the management of any sizable group. Combining the cashflow and balance sheet forecasts with a profit & loss forecast gives the 360-degree view of the future of the business. In Calxa you can generate these reports for your consolidated group for up to 10 years ahead.
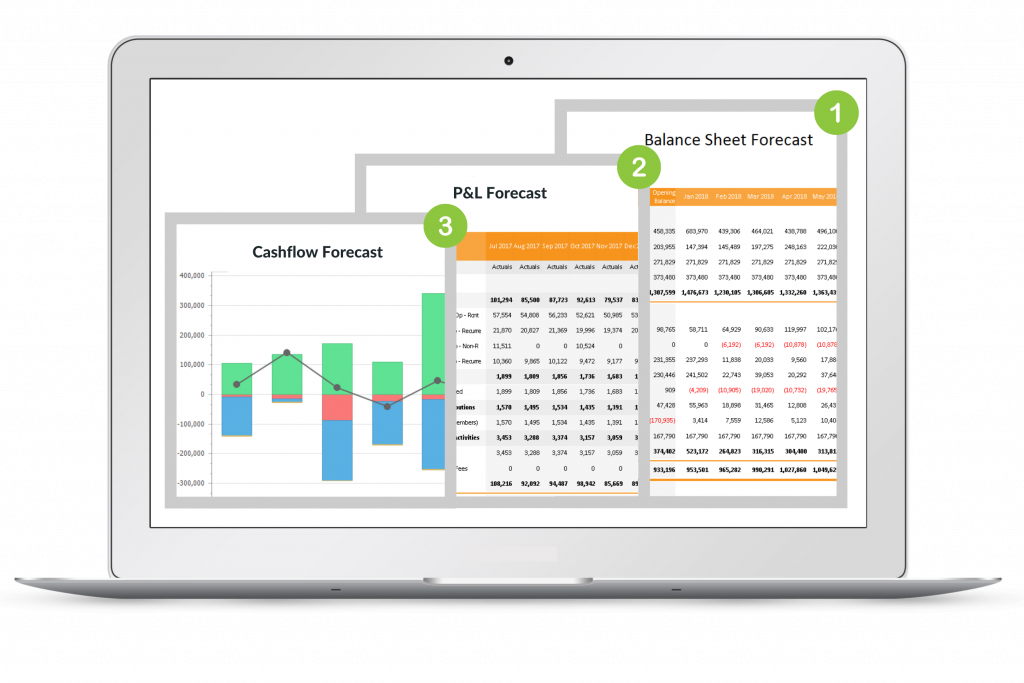
Depending on your audience, you will sometimes want a chart to represent this information, sometimes a summarised report and sometimes all the gory detail. A good reporting tool should always give you this choice.
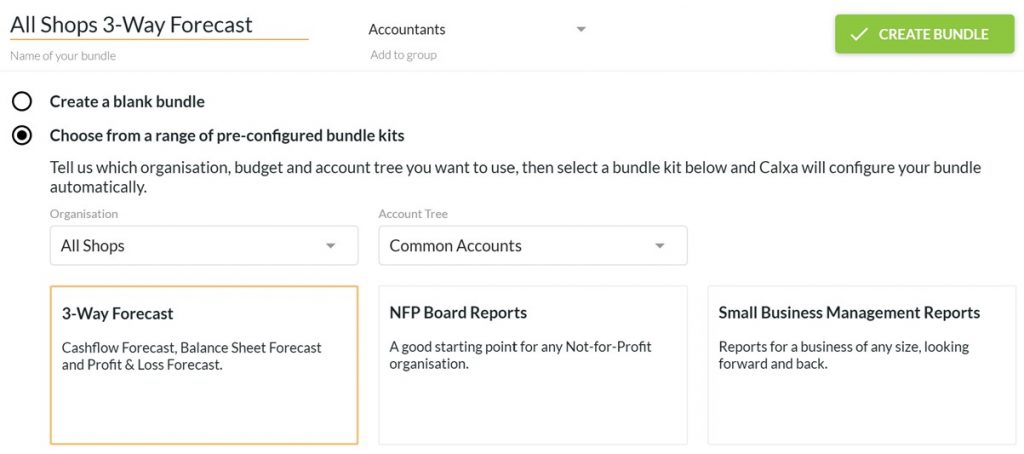
Calxa has a Report Bundle Kit ready to go, for instance. Just go to bundles, create a new bundle and select the 3-way forecast. Choose your consolidated group and it will create the full set of reports for you.
Reviewing Multiple Scenarios in your Consolidated Cashflow Forecast
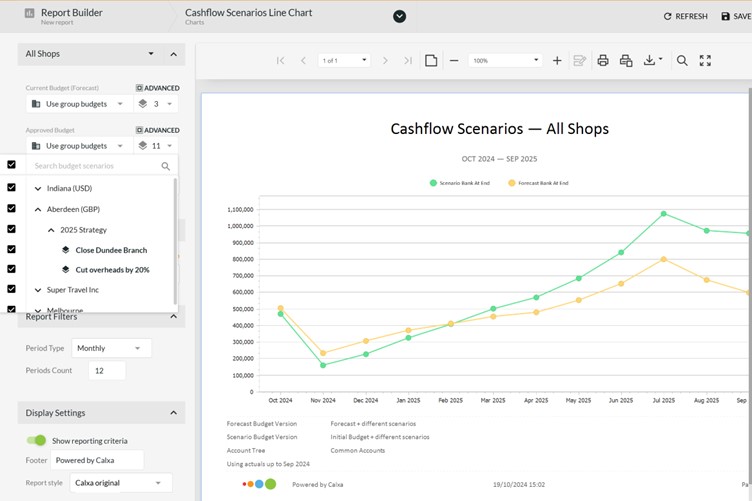
The 3-way forecast is important but you also want to consider other options for the future of your group. Build scenarios to model the different possibilities and then use something like the Cashflow Scenarios Line Chart to see the effect on your cashflow. You can then incorporate the same scenarios into your Balance Sheet and P&L Forecasts. You have the flexibility to set a default budget for each entity in the group or to override this at report time.
Comparing the Entities in a Group
It is not always enough to just add up the individual entities to get your multi company reports. For instance, there are times when you need to compare and contrast. In these cases, you want to see them side-by-side to show what is similar and what is different. Calxa has report templates built-in ready for you to view the Profit & Loss statements or the Balance Sheets with one column for each entity. You can choose to include every entity in the group or just a subset of them. For example, you could show just one region.
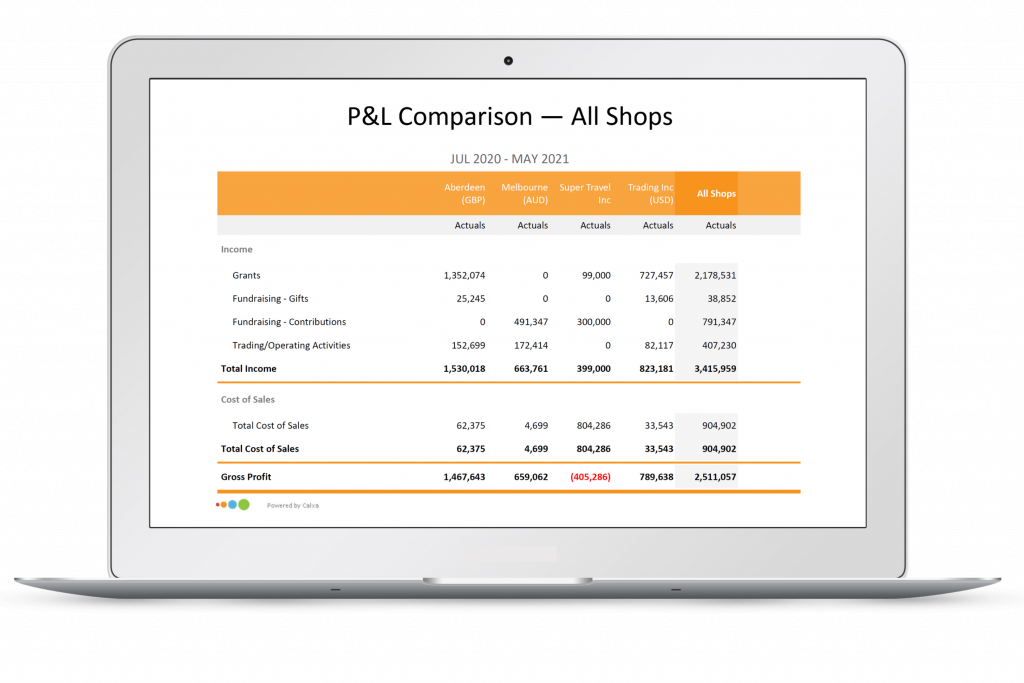
There are similar comparison reports for the Cashflow Forecast, Trial Balance and Cashflow Statement. You will find these very useful with trouble-shooting unexpected amounts in your consolidated reports. By seeing the individual organisations that make up the numbers you can see clearly where to focus your efforts.
Summarising Multi Company Reports in a Consolidated Group
Good, flexible reporting is about viewing the same information in different ways. Consider that people in different parts of the group have different perspectives. For example, for board members and senior managers, summary information is especially important. They need the right amount of information to be able to make decisions and to account for their responsibilities. What they do not want, is to drown in detail.
For this reason, Calxa includes a summary report showing just one line per organisation. To use this, look for the Business Unit income and Expense Summary template. It includes budgets and actuals for the selected month and year to date. As a result, from this the reader can easily see which companies are on target and where there might be problems. Essentially, identifying this information quickly enables them to focus their energies on the important problems.
Reporting by Department in a Consolidated Group
Sometimes, it’s not the overall group you want to report on. For example, if you have a Sales department in each company, you may need reports on the performance of Sales across the whole group.
![]()
The solution to this is simple:
- Create a Business Unit Tree that includes the Sales department from each company.
- Select the report you want (whether it’s a simple Profit & Loss statement or one of the many Actual vs Budget reports).
- Filter the report for your Consolidated Group and then for your Business Unit Tree.
- The report will show the Business Units that are included in the Tree and in the Group.
If you are reporting on all your departments across all your companies, you may find it useful to export the business unit tree to Excel, populate the details there and then re-import to Calxa.
Ultimately, Calxa is built to give you the flexibility to produce the reports you need to manage your group better.
Learn About Group Consolidation Reporting
If you want to try consolidated reporting and you are new to Calxa, use this article from our Help Centre or watch this Web Chat: Consolidate Multiple Entities.
