Recruitment KPIs can give you an interesting perspective to your business. Generally, recruitment is something that most business owners or managers get involved with from time to time. For some it’s a regular part of their job, whilst bigger businesses will have a dedicated HR department to manage the process. But how do you measure the success or otherwise of that process?
We will explore what some of these KPIs can encompass and how to calculate and ultimately add to a visual dashboard.
Best Recruitment KPIs for your Business
Here are some Recruitment KPIs that will help you measure your recruitment success.
Time to Hire
This is a measurement of the number of days between advertising the role and hiring someone. It usually, but not always, correlates to your cost per hire.
Record the number of days as a metric in Calxa each month.
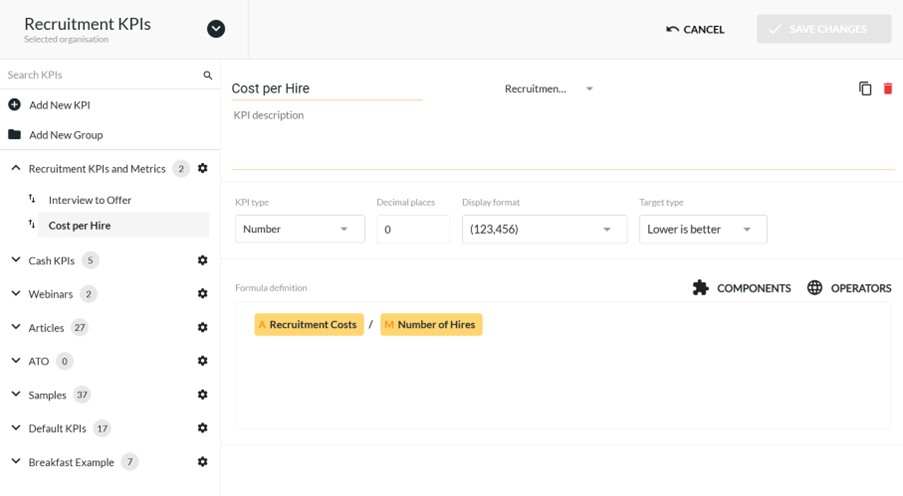
Cost per Hire
How much does it cost you to recruit each person?
Track those costs in your accounting system and use a KPI Account Group to collect them together.
Include fees you pay to recruitment agencies, ads on Seek and other services and overseas sponsorship costs.
The cost per hire KPI is then Recruitment costs divided by the number of people hired.

Applicant to Interview Ratio
This KPI looks at the number of candidates who apply, compared to the number you interview. A higher ratio might indicate issues with sourcing and screening because that process should result in only qualified candidates that meet your needs.
You ideally want a lower ratio here as that indicates you don’t have to weed out lots of unsuitable applicants.
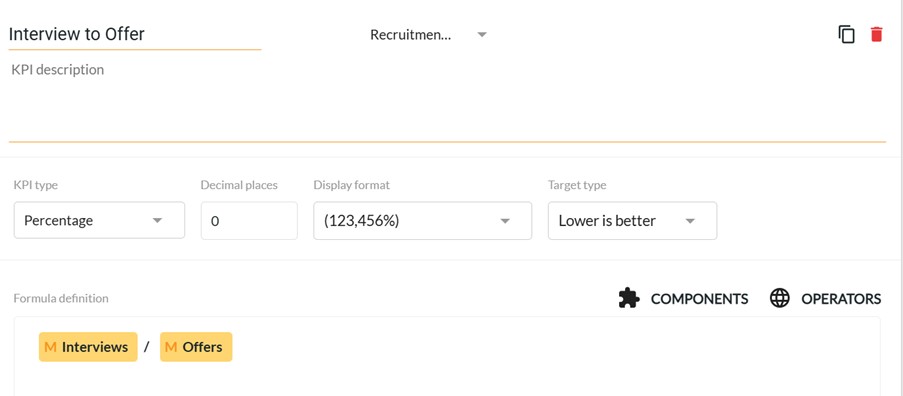
Interview to Offer Ratio
Interviews are vital to recruiting, but they are often a time-consuming activity for candidates and hiring managers. An unsatisfactory interview to offer ratio creates a higher cost per hire.
The optimum interview to offer ratio is generally regarded as around 3:1.
If you average a higher rate, review your process for selecting candidates for interviews. Then focus on your sourcing and screening activities and KPIs like the applicant to interview ratio to ensure you are finding the right candidates.

Time to Productivity
How long does it take your new hires to make their full contribution to the organisation? Oxford Economics in the UK estimated 23 weeks for a retail worker, up to 32 weeks for legal and accounting staff. That will obviously vary with the complexity and seniority of the role but you should be able to establish a benchmark for your business.
One method of doing this is to record the time it takes new employees to meet their initial KPIs. Matching the right people to the role will give you a lower time to productivity so it’s an important KPI for hiring as well as your onboarding process.
Create Your Recruitment KPI Dashboard
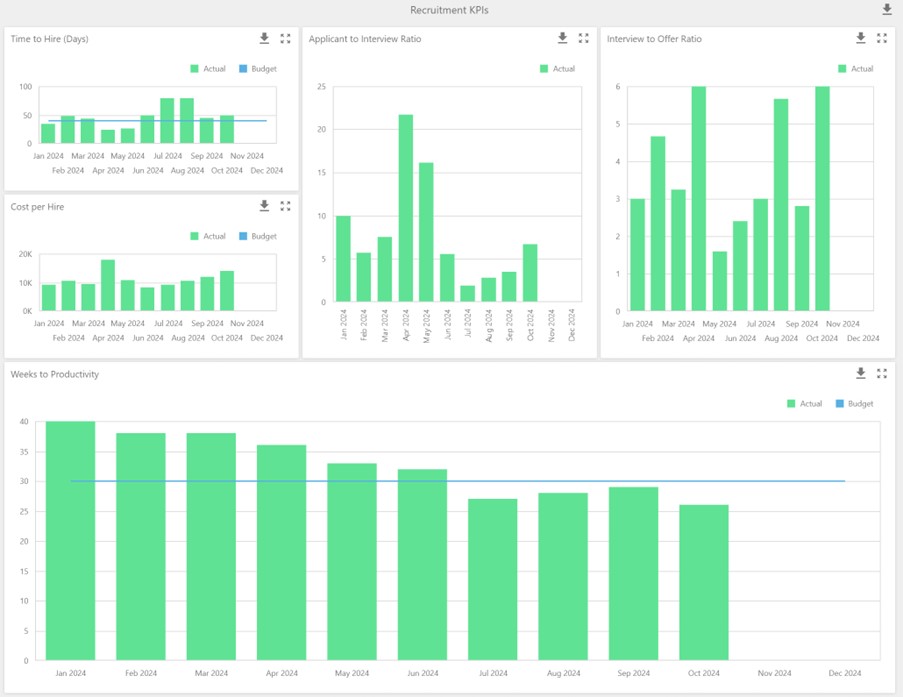
Whilst we provided a selection of useful recruitment KPIs, this article has more metrics for you to contemplate. But ultimately, you want to be able to visualise these ratios and KPIs. For this, you need to create a dashboard that will graphically display these measurements for you.
Before you start, think up a plan of what you expect to see on your Dashboard. Then, as a user of Calxa, you will need to follow three steps:
- Create Metrics – these are non-financial values you can add to Calxa – they sit outside your accounting data.
- Build KPIs – use the KPI Builder to formulate values based on your newly created Metrics.
- Build a Custom Dashboard to display your KPIs – this help note outlines your starting point.

There are many more KPIs you can add to your dashboard, of course, and our guide will help you with that.
