Calxa Resources
Where Did Our Money Go? Calxa Report
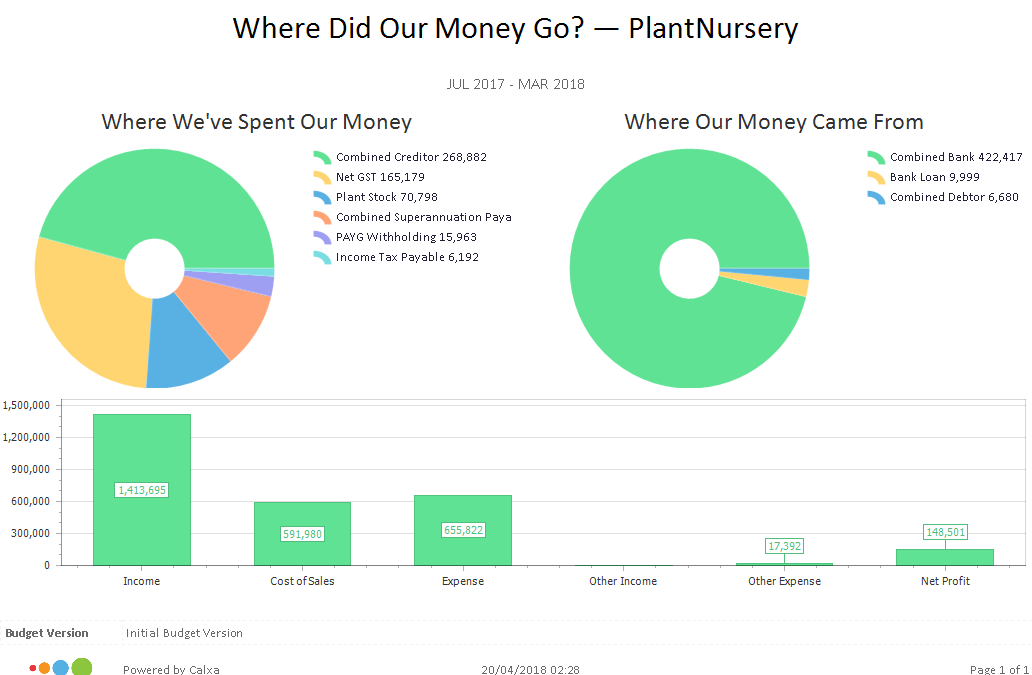
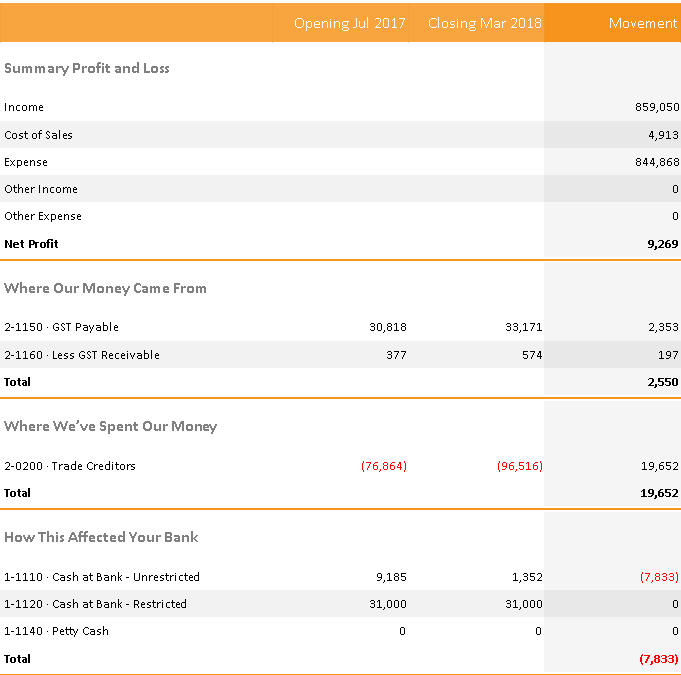
How to use Where did our money go report. Quickly grasp the connection between your net profit and change in bank balance. See the movements in key Balance Sheet accounts and how they have affected your cash...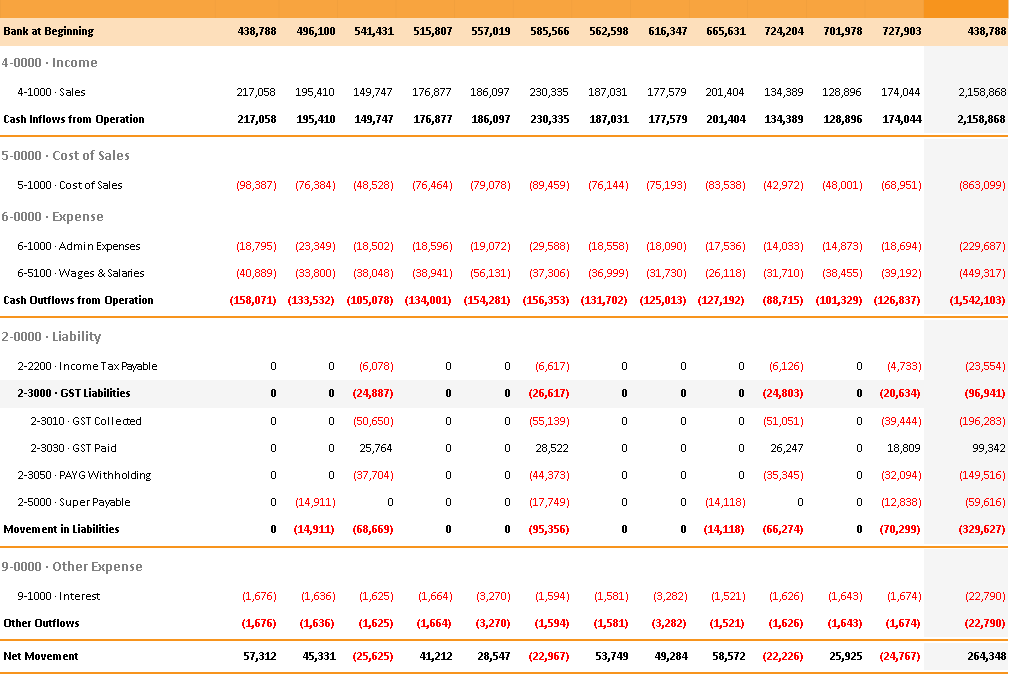
Cashflow Forecast Calxa Report
How to use the Cash flow forecast Report Understand the detail of your future cashflow including expected receipts and payments, what’s needed for tax and payroll liabilities and when you need to source additional funds....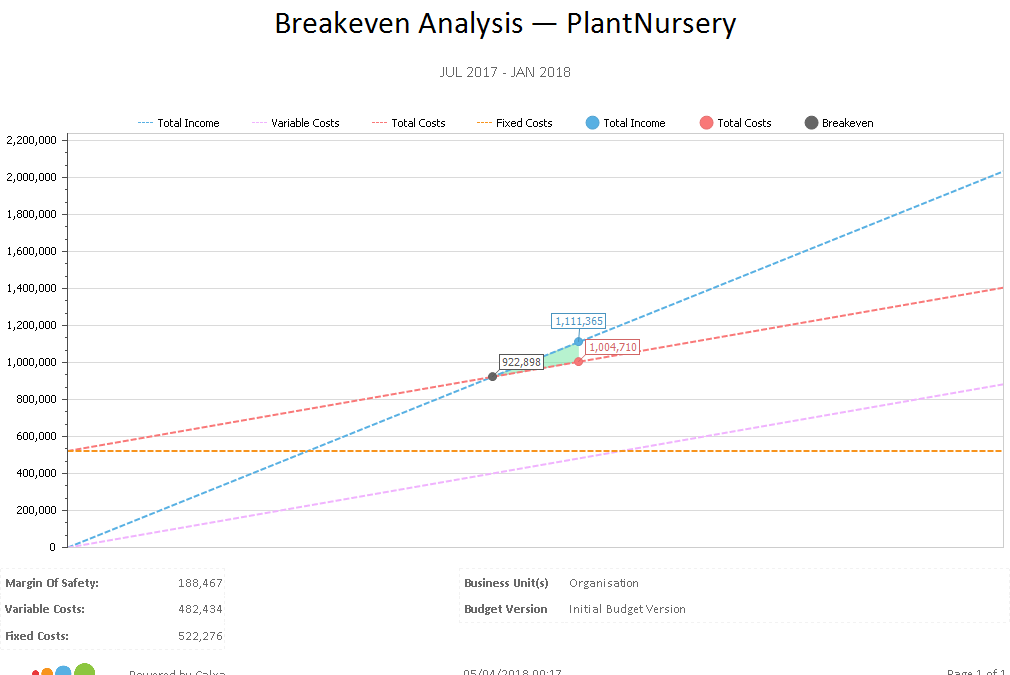
Breakeven Analysis Chart
Show cost centre managers just the detail they need to get the job done. In this example that’s one cost centre and just the expenses that the manager controls. Quickly see what has been allocated and what’s left to spend.