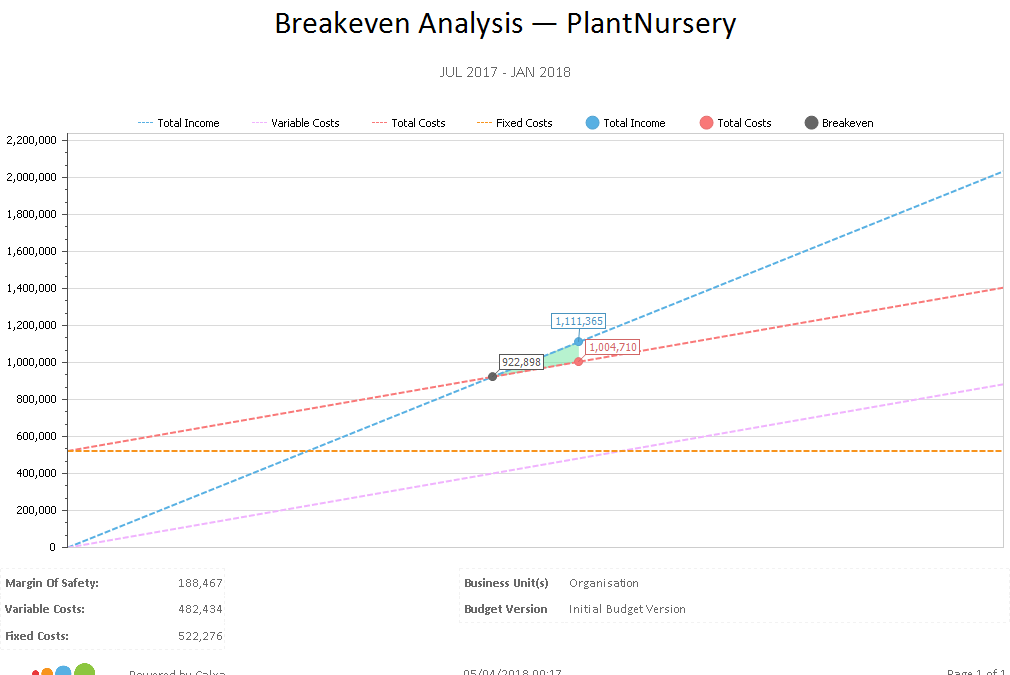
Breakeven Analysis Chart
Show cost centre managers just the detail they need to get the job done. In this example that’s one cost centre and just the expenses that the manager controls. Quickly see what has been allocated and what’s left to spend.
Show cost centre managers just the detail they need to get the job done. In this example that’s one cost centre and just the expenses that the manager controls. Quickly see what has been allocated and what’s left to spend.
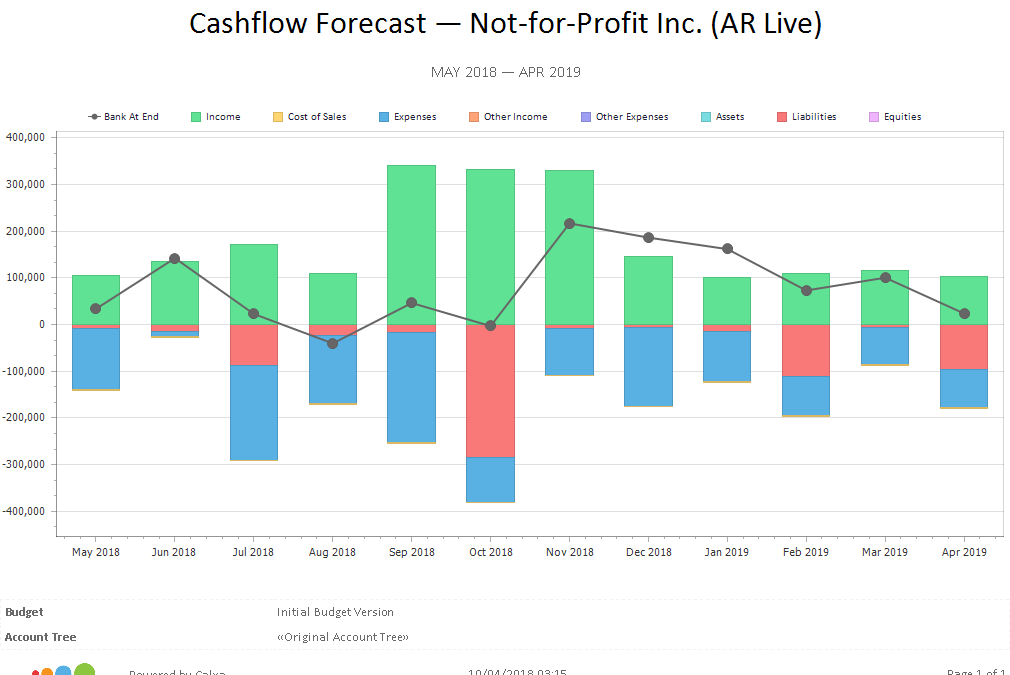
One of the most important reports any business should run on a regular basis. It shows the bank balance looking forward to highlight upcoming tight spots. Displaying the bank balance line across the bars sectioned into income, expenses, assets and liabilities it gives a good idea of what drives the cash.
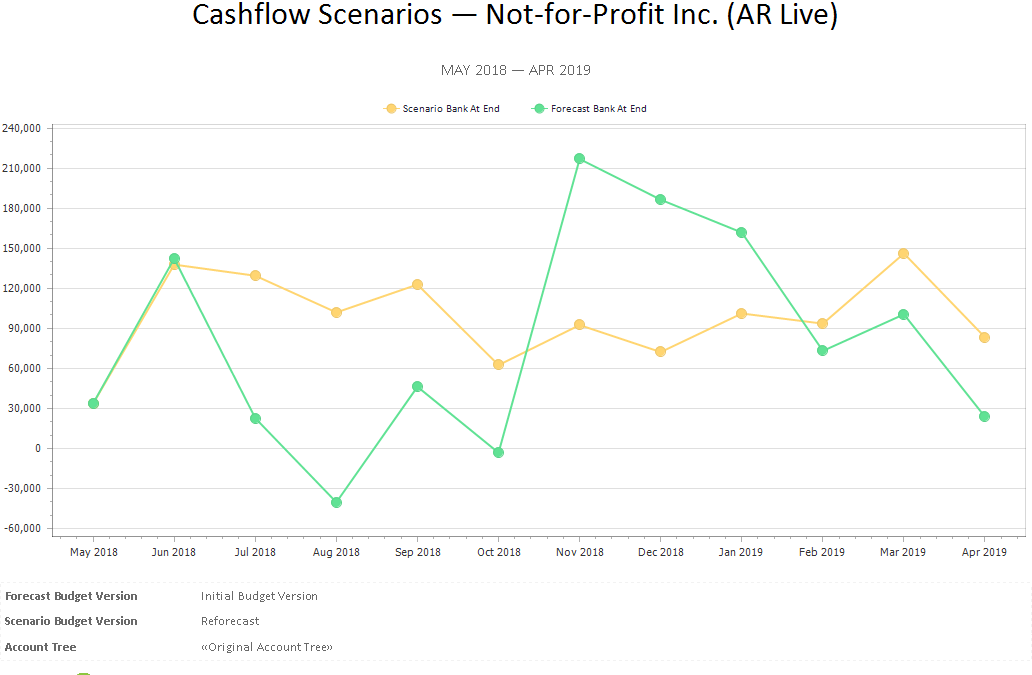
A great planning tool, the cashflow scenario can easily compare ‘best case’ with ‘worst case’ highlighting what needs to be achieved to reach set goals.

Budget vs Actual comparisons can help manage grant funding for Not-for-Profits but also track against strategic goals.