The NDIS Accommodation Provider runs a tight operation. Ideally, you want to achieve a 100% occupancy rate each night knowing the services are reaching the people in need. Reality is that a full house is not always possible. Of course, fixed costs are applicable whether the bed is occupied or not. In this light, it makes sense that this affects the cost per bed-night which under the NDIS program needs to be claimed back. So, calculating the price for a bed-night is critical.
What’s the Cost of a Bed for the Night?
Accommodation providers of all sorts, from 5-star hotels to hostels for the homeless, are concerned about the cost of providing accommodation. While the hotel has the luxury of deciding what price they charge for a bed, subject to finding customers willing to pay, providers of beds to the elderly or people with disabilities mostly work with fixed prices as their ultimate payer is the government.
Working out the cost of providing the bed is, in principle, fairly simple. You add up all the costs associated with making that bed available to your guest over a given period and then divide by the number of bed-nights provided. Calxa’s Unit Costing: The Ultimate Guide will help you determine some key metrics.
What is a Bed-Night?
Essentially, it’s one bed occupied for one night. While this is a common measurement some people are more concerned with room-nights. This is where one room is occupied for one night. Alternatively, a NDIS Accommodation Provider can work off person-nights. This bases the cost on each person who occupies a bed or room for a night. Regardless of which you use, the process is the same.
What Costs Do you Add Up and How?
The simplest method is to use the tools in your accounting system. If you’re using MYOB, use Jobs to identify the costs, use Tracking Categories in Xero or Classes in QuickBooks. They all work in a similar fashion and Calxa will provide the reporting tools to then get the information you need. Use our Financial KPIs Guide to better understand the principles.
As an NDIS Accommodation Provider, you should aim to include all significant costs related to the provision of the accommodation. Some of this is easy to identify while some requires splitting and reallocating costs from other areas. Always keep in mind the scale of the cost you are looking at and consider the time and cost of allocating them against the benefits of more accurate costing. If you can get 95% accuracy with a simple system, do you really need to spend an extra 10 hours a month getting to 99% accuracy? Will that extra accuracy help you make better management decisions? Sometimes it will and the effort is worth it, but often the 95% figure is as good as you need.
Adding Bed-Nights to Calxa
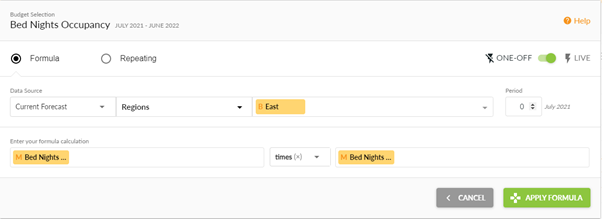
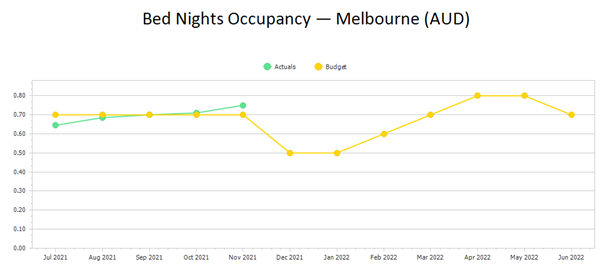
Metrics are the feature you need to track your non-financial data, such as the number of bed-nights. Enter a monthly budget at the beginning of the year and then update the actuals each month. Add a metric for your daily capacity so that you can also report on occupancy rates. A repeating formula is ideal for this as you can set the budget based on the number of days in the month.

Then you can set your Occupancy as a percentage of Capacity. Or, if you have seasonal variations add an additional metric for the monthly occupancy rate.
The Occupancy metric is then the capacity x occupancy.


If you have a benchmark for your costings, enter that as a metric and set budgets for that each month.
Then create KPIs for the numbers you want to report. Once you have Account Groups set up for Accommodation Revenue and Accommodation Costs, the formulas are simple:
Bed-Night Costs
[Accommodation Costs]/[Bed Nights Occupancy]
Bed-Night Profit
([Accommodation Revenue]-[Accommodation Costs])/[Bed Nights Occupancy])
NDIS Accommodation Provider Occupancy Rate
[Bed-Nights Occupancy]/[Bed-Nights Capacity]
No of Bed-Nights
[Bed-Nights Occupancy]
Note that some of these formulas combine the Account Groups with the Metrics.
Reporting for the NDIS Accommodation Provider
If it’s the numbers that are important to you, add the bed-night KPIs to any of the Profit and Loss or budget reports. Clear the Show Accounts option if you just want the KPIs.

Sometimes though, a picture tells a better story and the KPI Spreadsheet Comparison chart is perfect for something like comparing your actual costs to the benchmark. This chart can display both KPIs, giving you that comparison to your benchmark.
Monitoring these KPIs will give you valuable information when planning and making decisions. Fixed costs in a business will increase the total cost per unit when volume is low – so it’s important to understand the break-even volume and take steps to increase occupancy in traditionally slower months. A business will survive one or two months of small losses but not if they are sustained. Sometimes those small losses are the price that has to be paid to maintain a skilled staff for the rest of the year – the trick is to ensure that they are small losses and are consciously managed.
If you want to learn more about unit costing, have a look at our guide.
