The Australian Taxation Office (ATO), like many similar organisations around the world, uses benchmark ratios and data to monitor business performance. If your business strays outside the benchmarks for your industry you are more likely to face an audit, or at least questioning. By comparing your performance against these ATO benchmark ratios yourself, you can review your operations and keep out of trouble.
Measuring your small business by ATO standards is important to stay on the good side of the tax department. An unexpected letter in the mail or phone call from the tax man can be somewhat unnerving. One of the reasons that you may hear from them could be that you have fallen outside of the standard industry benchmark ratios.
Knowing the ATO benchmark ratios for your business will help you monitor your compliance. In itself, it’s not wrong to be outside the benchmarks and there are often good reasons for that being the case. But, you should be prepared to explain those reasons. Sometimes it’s because your business is new, or going through a major change. At the very least you should discuss the situation with your accountant. They can provide advice and make sure you are recording your transactions correctly.
You can check out our tips to effectively manage these ATO benchmark ratios.
Performance and Input Benchmarks
With the advent of increased data processing technology and electronic communication, the ATO are now able to harvest and analyse an enormous amount of data from all businesses across Australia. With this comes the ability to provide Small Business Benchmarks based on historical information and trends. You will find these benchmarks broken down into performance benchmarks and input benchmarks.
Performance benchmark provide you with financial ratios to help your business work out how you compare to other businesses within the same industry. It offers you guidance on how your business may be able to make improvements. These ratios are calculated based on information provided on tax returns and activity statements.
Input benchmark ratios, on the other hand, shows you an expected range of income for tradespeople based on labour and materials. This is calculated based on information provided by industry participants and trade associations.
Beware if You Fall Outside the Benchmarks
The ATO promote the fact that these benchmarks have been developed to assist businesses. In other words, they help you to compare against other similar businesses based on industry and size. But they do also say that “Benchmarks are one of the tools we use to identify businesses that may be avoiding their tax obligations”.
An example of this is where businesses supply goods and services directly to consumers using cash payment methods. These businesses have demonstrated previously that they have a higher likelihood of deliberately using cash transactions to hide income and evade taxation obligations. This is just one example of where the ATO is trying to crack down on the ‘cash economy’. The Cost of Sales to Turnover ratio is frequently used to identify if your business falls into this category. If for some reason, your ratio exceeds the industry benchmark, then you may have some explaining to do.
There may be a valid explanation as to why you fall outside the ratio. For instance, this can include things such as business location or a change in trading conditions. You may have a lower mark-up than your competitors because you’re trying to grow the business. There could be increases in your costs that you don’t feel able to pass on to your customers without losing business. Regardless of the reason, it pays for you to be prepared to provide answers.
Use Calxa to Monitor Your SME Benchmark Ratios
There are ATO benchmarks available for many businesses based on industry and turnover. This includes everything from air conditioning services to watch and jewellery retailers. For example, for a Restaurant Business, the key ratios include:
- Cost of Sales/Turnover
- Total Expenses/Turnover
- Labour/Turnover
- Rent/Turnover
- Motor Vehicle Expenses/Turnover
The benchmark for motor vehicle expenses for a restaurant with a income under $500,000 is 1%-2%. If your ratio is much higher than that, they are likely to question the accuracy of your split between private and business use of the vehicles.
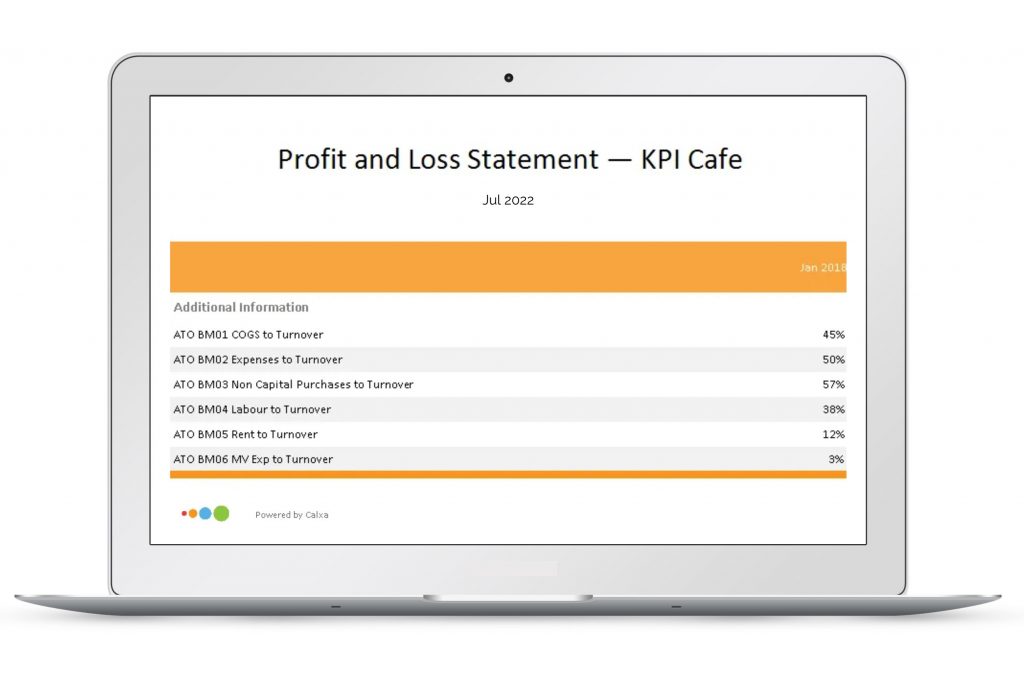
Use the Cost of Sales/Turnover ratio and Labour/Turnover ratio which are default KPIs already included in Calxa. However, you can create new customised KPIs for the other ratios. Then you report on them either separately or add them to other reports. In line with this, you can create a KPI group so you can find the related KPIs when you need them, and sort them in a sensible order for your reports.

So, if you are involved in an industry that the ATO has identified as being one that has historically had a high level of cash transactions then it would pay to monitor your activities. Especially if for some reason you happen to fall outside of the standard industry ratios. In other words, be prepared to answer some questions. On the other hand, you may simply just like to see how you compare to other businesses in your industry.
If your Cost of Sales ratio is higher than the average, is that because you:
- Aren’t charging your customers what you could?
- Or that you are paying too much for your purchases?
You may decide that you’re happy with the higher ratio because you are wanting to grow the business quickly by competing on price, but at least you have asked yourself the questions.
Comparing your Ratios to the Benchmark
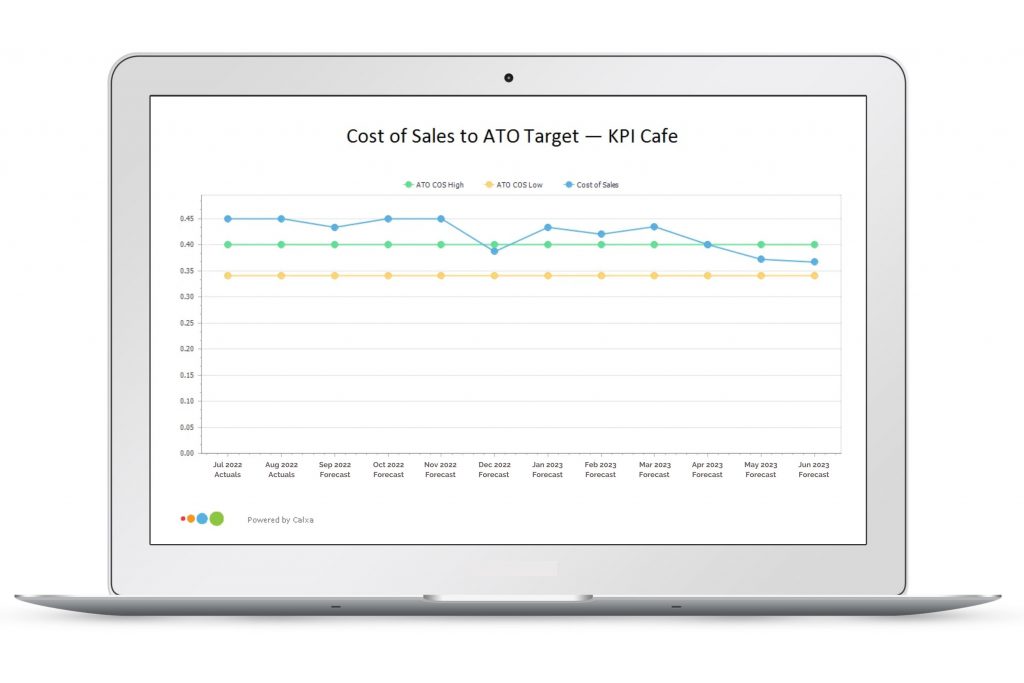
Using Metrics you can add in the ATO Benchmark Ratios and easily compare it to your own results. For example, if you’re running a coffee shop with a turnover of $500,000, the ATO benchmark ratio for Cost of Sales is 34% – 40%. Add a Metric for the lower ratio, entering it as .34.
Tip: select the entire row and use a formula to enter the value of 0.34 each month and another for the higher one. Now create a KPI for each that is simply using that Metric.
You will find an in-built KPI to calculate your Cost of Sales. Simply combine these 3 on the KPI Spreadsheet Comparison report to track your performance against the benchmark. As a result, you will now see when you stray outside the guidelines. Another option would be to include the 3 numbers in a data source and use a dashboard to review your ratios each month.

In the example shown, you can see that the café had a Cost of Sales ratio above the guidelines at the beginning of the year. After that, it took steps to change their buying and pricing practices to reduce it to within the ATO guidelines. In addition, this really improved their bottom line at the same time.
Getting Started with Benchmark Ratios
To start tracking these ratios, use our Financial KPIS for Business Guide and read some of our other articles. They guide you on how you can create KPIs and Metrics to build your own swag of ATO Benchmark Ratios and other performance KPIs. Have a look at these articles 7 KPIs for Retailers and Metrics and KPIs for Hospitality.
Whilst for NFPs Importance of KPIs for Not-for-Profit Organisations is a good starting point. And, those bookkeepers that want to grow, KPIs for a Bookkeeping Practice will give you some ideas on benchmarking against the rest of the industry.
