Not‑for‑profits are facing unprecedented financial pressure. For many organisations—particularly NDIS providers and service‑based charities—funding is less predictable, payment timing is uncertain, and boards are being asked to make faster, higher‑impact decisions with greater accountability.
Getting the Mix of Reports Right for Not-for-Profits
At the same time, board composition is changing. Modern not‑for‑profit boards often include members with strong governance, community, and sector expertise—but not necessarily deep financial literacy. This places increased responsibility on management to deliver financial reports that are clear, relevant, and decision‑focused, not just technically correct.
In this environment, financial reporting is no longer about compliance or historical performance alone. It is about understanding risk, protecting cash flow, and ensuring long‑term sustainability.
This article outlines seven essential financial reports every not‑for‑profit should be using. Together, these reports help boards, CEOs, and finance teams move beyond static financial statements and towards forward‑looking, board‑ready reporting that supports confident decision‑making—even in times of funding uncertainty.
1. Unspent Budget Report for Grant & Program Control
An Unspent Budget Report remains one of the most practical tools for managing grant‑funded and program‑based activity.
In an environment where funding is increasingly tied to outcomes, milestones, or service delivery (rather than fixed annual grants), underspending can be just as risky as overspending. Unspent funds may trigger questions from funders or indicate delivery risks that need early intervention.
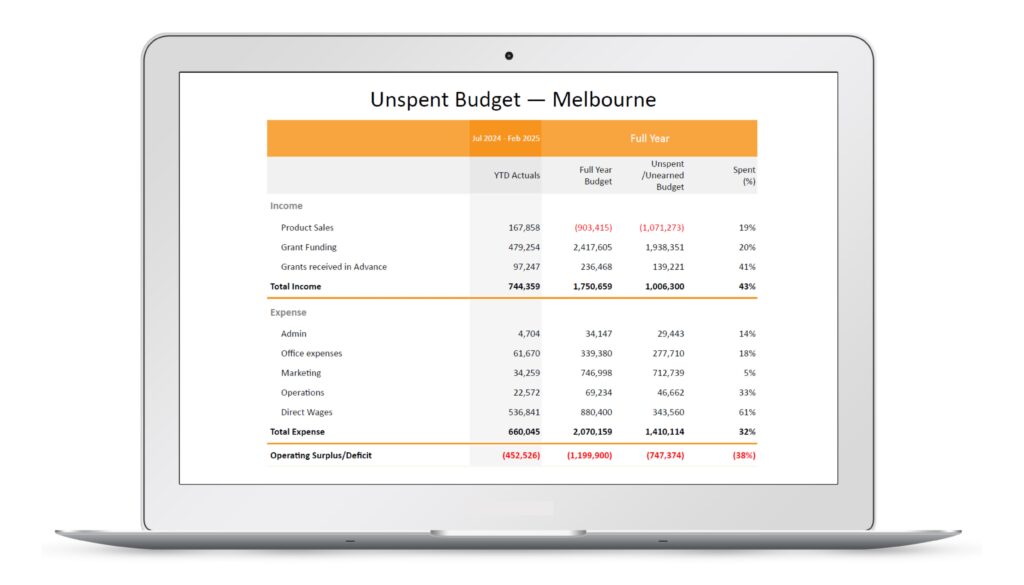
What this report helps answer
- Are programs tracking to budget?
- Are we at risk of underspending grant funds?
- Do we need to re‑allocate resources or adjust delivery plans?
Who uses it
- Program Managers
- Finance teams
- CEOs and Executives
When to review
- Monthly
- Before grant acquittals or milestone reporting
2.Cash Flow Forecast: The Foundation of Sustainability
Cash flow forecasting has become non‑negotiable, particularly for NDIS providers dealing with delayed payments, claim rejections, or fluctuating service demand.
A Profit & Loss statement may show a surplus, but it won’t tell you whether the organisation can meet payroll next month. A forward‑looking cash flow forecast gives boards and management visibility over what’s coming—not just what’s already happened. The chart is perfect for the less financially-literate board members while the summarised numbers will give others the information they need.
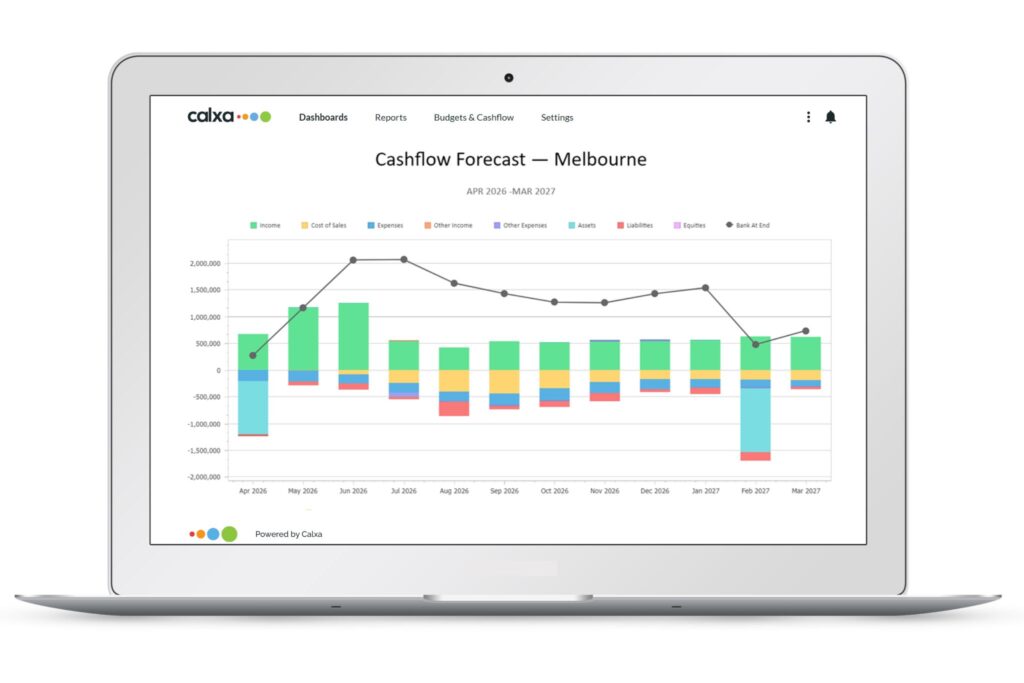
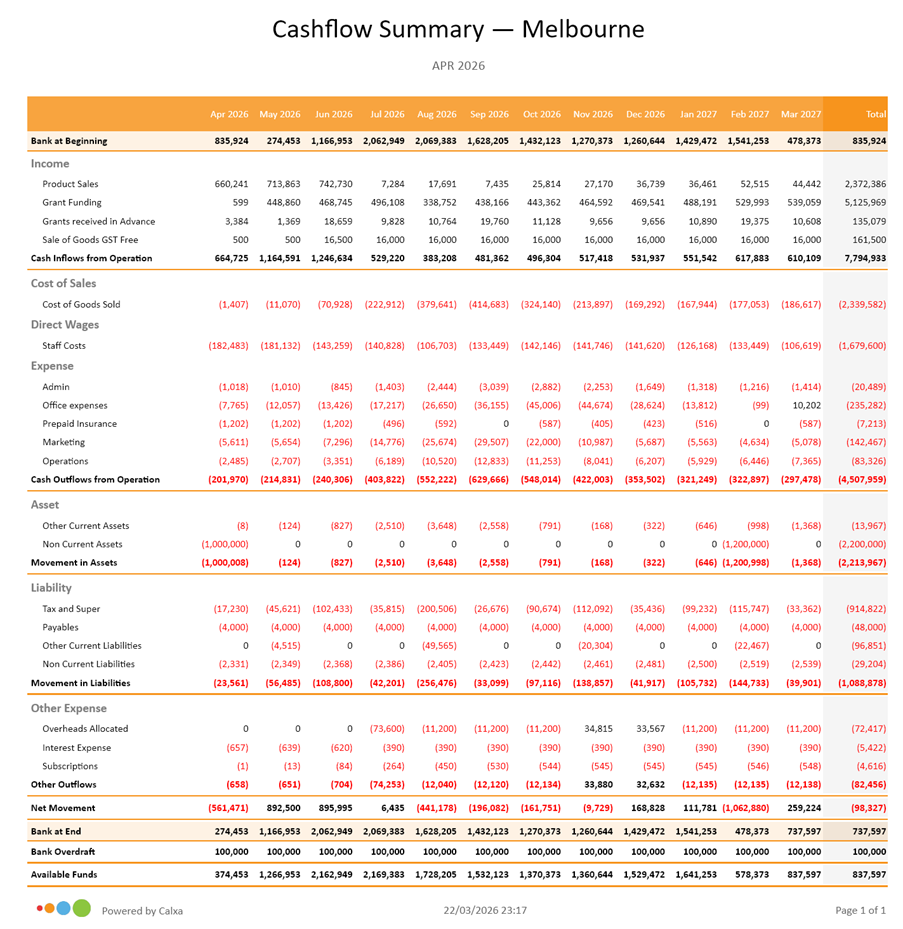
What this report helps answer
- Do we have enough cash to meet obligations over the next 3–12 months?
- What happens if payments are delayed?
- How resilient are we to funding shocks?
Who uses it
- Board members
- CEOs
- Finance Managers
When to review
- Every board meeting
- Updated whenever assumptions change
3.Actual vs Budget with Clear Variances
To measure performance without complexity, this simple structured budget report is useful for Boards who don’t need more numbers. Instead, they need clear explanations.
A Budget vs Actual report, presented with meaningful variance commentary, helps boards focus on what matters rather than drowning in detail. In 2026, best practice is to summarise first and add detail only when required. While the standard templates will work well most of the time, it’s easy to create a similar report as a Dynamic Template and include visual traffic light indicators on variances which can contribute to easy understanding. Add a document to the report bundle for commentary on your variances.
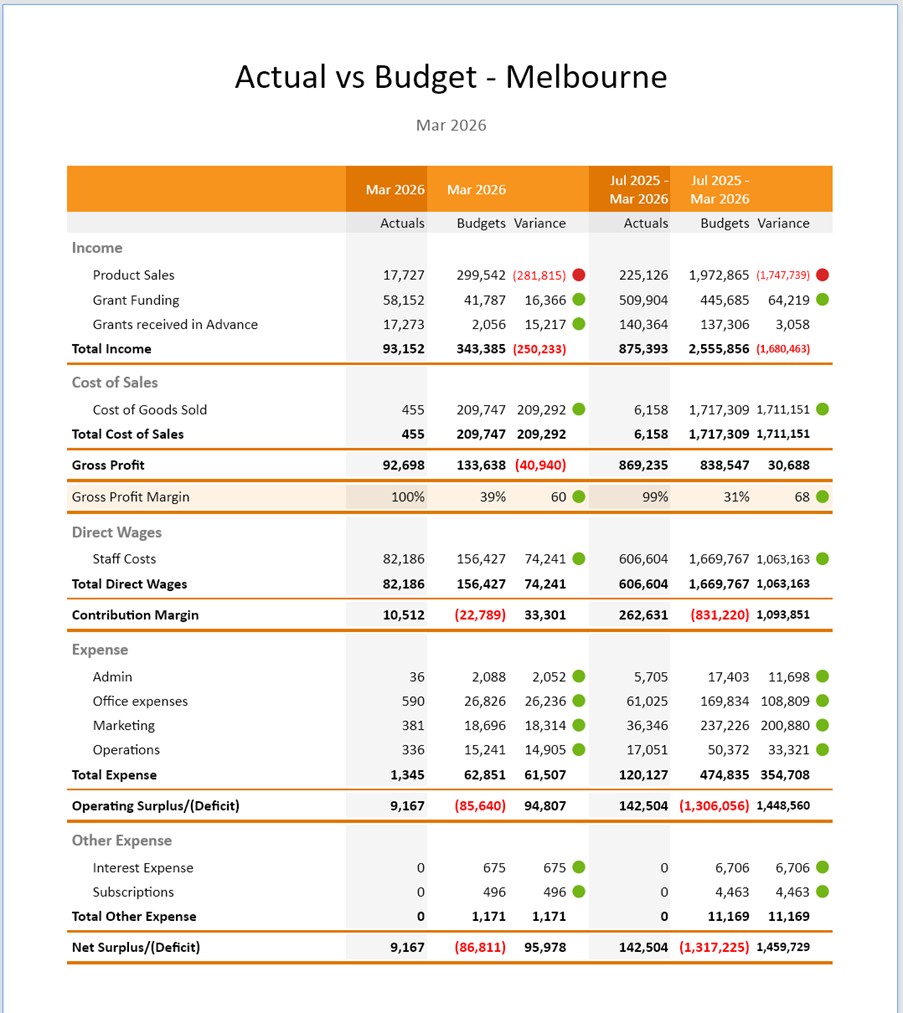
What this report helps answer
- Where are we materially ahead or behind plan?
- Are variances timing‑related or structural?
- Do we need to revise forecasts?
Who uses it
- Boards
- CEOs
- Senior Management
When to review
- Monthly or quarterly
4. Program or Service Line Performance Report
Using the Business Unit Income and Expense Summary template and is great for NDIS and Activity‑Based Reporting. For NDIS providers and other service‑based NFPs, not all programs contribute equally to sustainability.
A program‑level performance report allows organisations to see which services:
- Cover their costs
- Contribute to overheads
- Or quietly erode financial capacity
This is not about mission drift—it’s about ensuring the organisation can continue delivering its mission.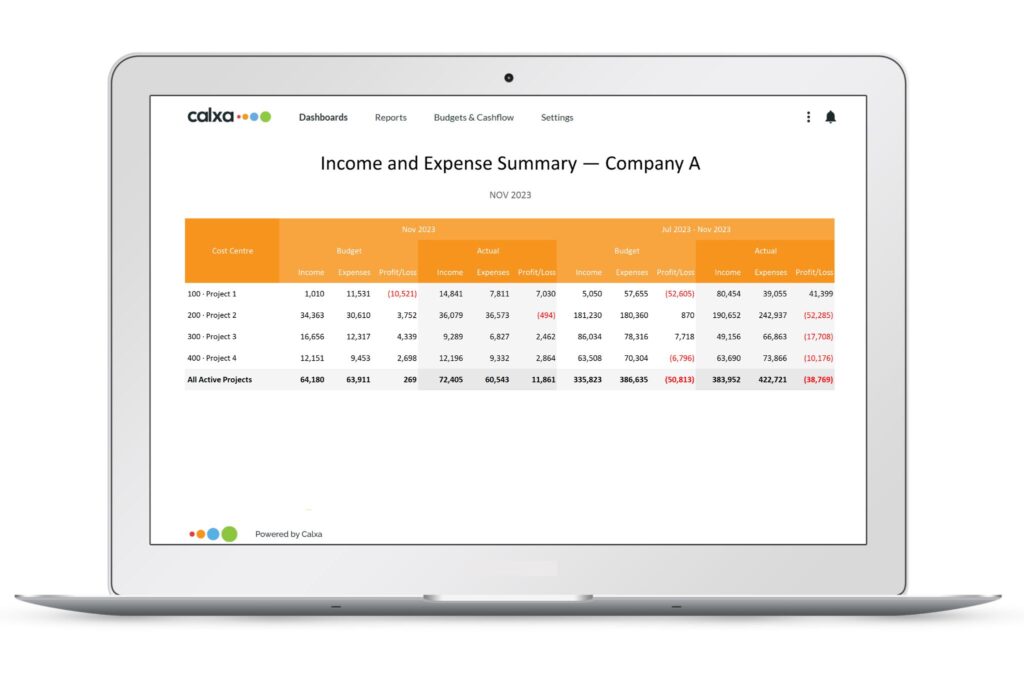
What this report helps answer
- Which services are financially viable?
- Are prices covering true costs?
- Where should we focus growth or redesign efforts?
Who uses it
- CEOs
- Executive teams
- Boards (at a summary level)
When to review
- Quarterly
- During strategic planning
5. Balance Sheet with Prior Period to show financial strength over time
Many boards focus heavily on income and cash—but long‑term sustainability lives in the balance sheet.
In 2026, funders, regulators, and lenders increasingly look at reserves, working capital, and liquidity when assessing organisational risk. Boards don’t need accounting theory—but they do need clarity.
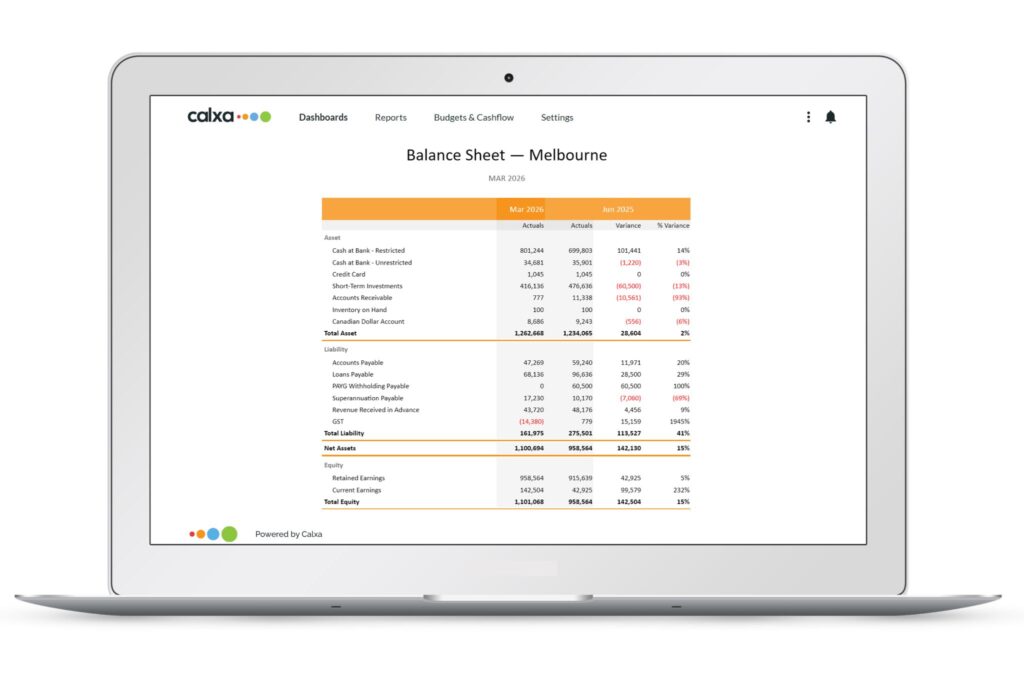
What this report helps answer
- How strong is our financial position?
- Are reserves adequate for our risk profile?
- Is working capital improving or deteriorating?
Who uses it
- Boards
- CEOs
- Finance Committees
When to review
- Every board meeting (with plain‑English explanations)
6. KPI Summary Dashboard to promote financial literacy without the jargon
Board literacy trends show a clear shift: boards want fewer reports, but better ones.
A concise KPI dashboard—covering metrics like cash reserves (days), surplus/deficit, program margin, and revenue concentration—helps boards quickly understand performance without wading through pages of detail.
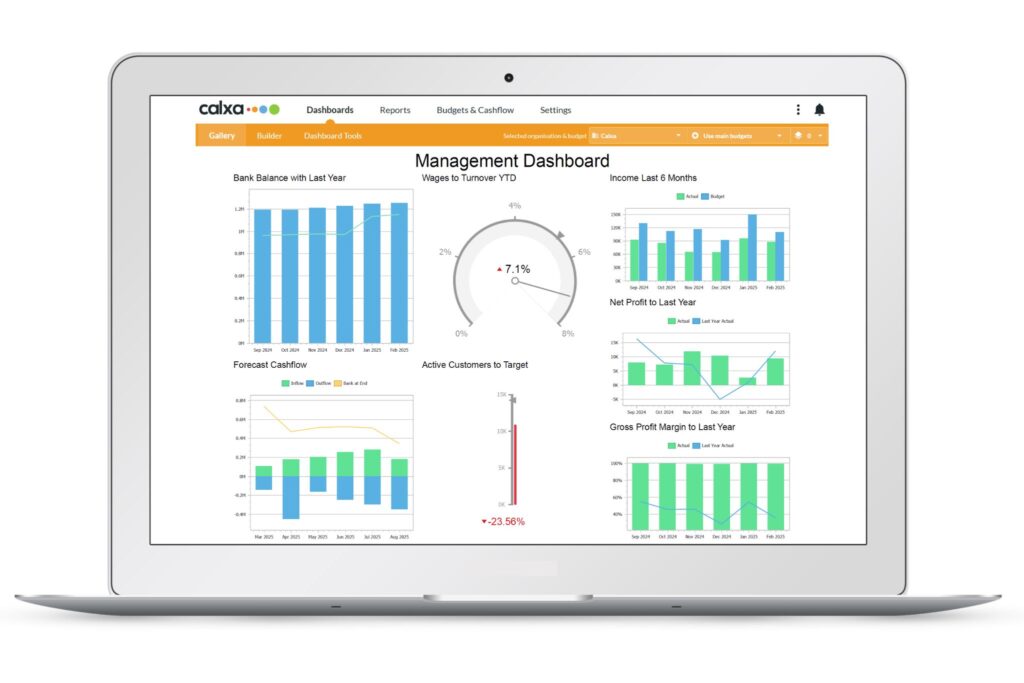
What this report helps answer
- Are we tracking within acceptable limits?
- Are any indicators flashing early warning signs?
- Where should the board ask questions?
Who uses it
- Boards
- CEOs
When to review
- Every board meeting
7. Scenario & Forecast Variations
Great when planning for uncertainty. These days, funding uncertainty is now the norm, not the exception.
Scenario reports allow organisations to model “what if” situations—for example:
- Reduced NDIS volumes
- Loss of a major grant
- Wage increases or indexation gaps
Rather than reacting under pressure, boards can make informed, pre‑emptive decisions.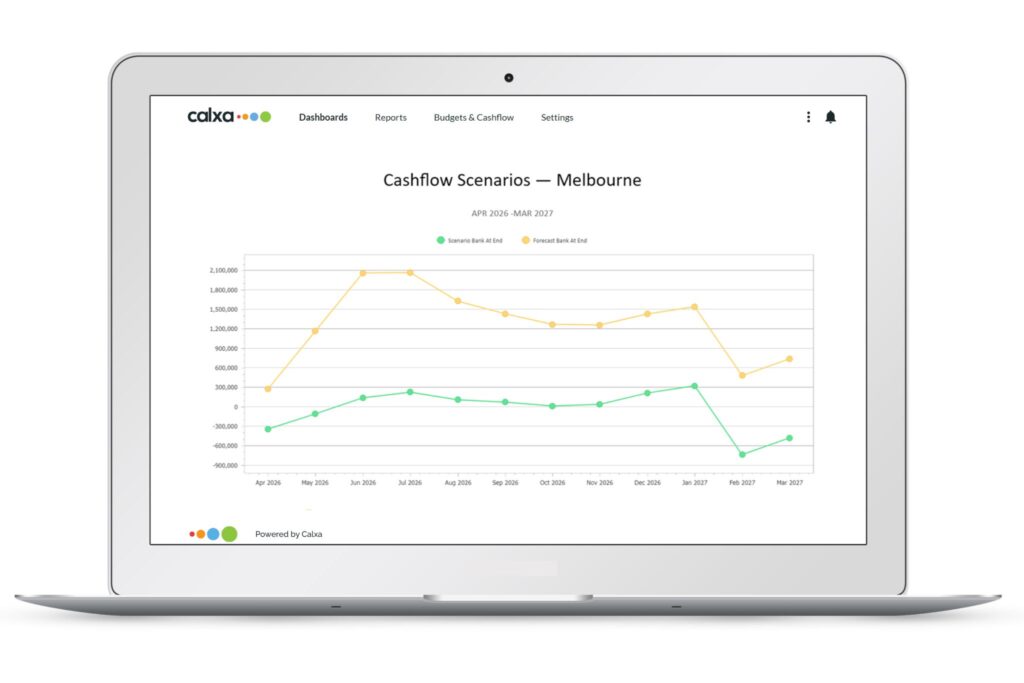
What this report helps answer
- How exposed are we to downside risk?
- What levers can management pull?
- How long do we have to respond?
Who uses it
- Boards
- CEOs
- Executive teams
When to review
- During budgeting
- When conditions change
Reports for Not-for-Profits: Bringing It All Together
No single report tells the full story. The real power comes from using the right mix of reports, tailored to different audiences:
- Boards need clarity, trends, and confidence
- Executives need insight and forward visibility
- Program managers need control and accountability
In these stretched times, the most effective not‑for‑profits are those that move beyond compliance reporting and embrace clear, consistent, and decision‑focused financial reporting.
If your board pack still relies on static financial statements alone, this list is a strong place to start.
Calxa offers a standard NFP Reporting bundle (template with batched reports) which can eliminate hours, more often days, of report preparation. If you want to learn more about how to prepare budgets for your not-for-profit use this practical guide Using the Calxa Budgeting Tool.
For a real easy way to get going, check out the resources on our Getting Started Page and use our suggestions of three things to include in your board report article. Once you have decided on the selection of your reports make sure to read our article on automating board reports to save you some real time.