Calxa Resources
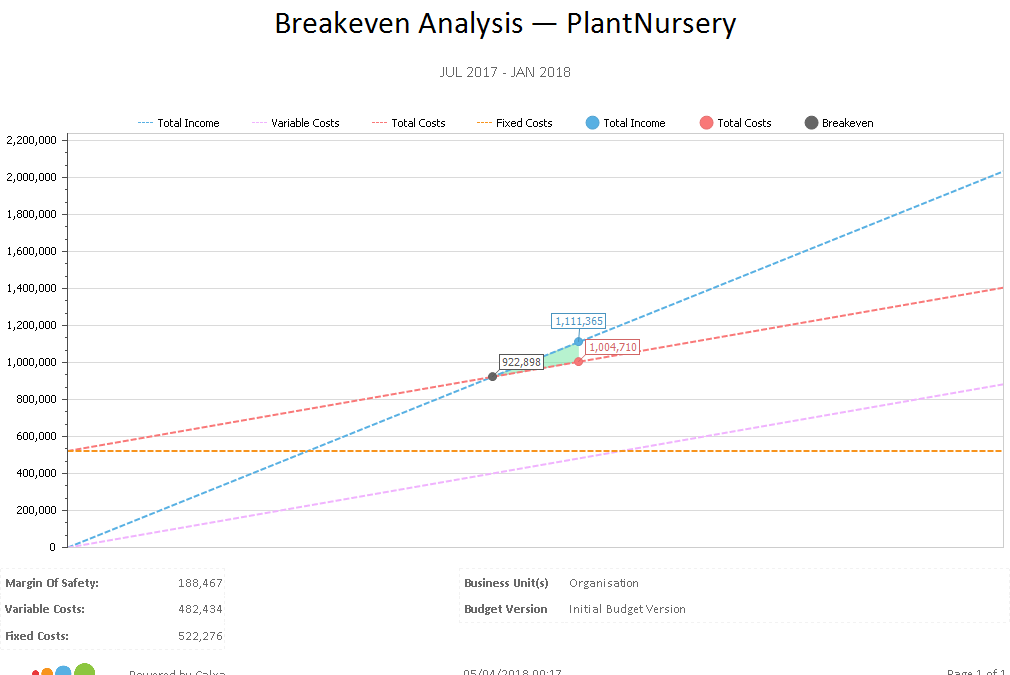
Breakeven Analysis Chart
Show cost centre managers just the detail they need to get the job done. In this example that’s one cost centre and just the expenses that the manager controls. Quickly see what has been allocated and what’s left to spend.
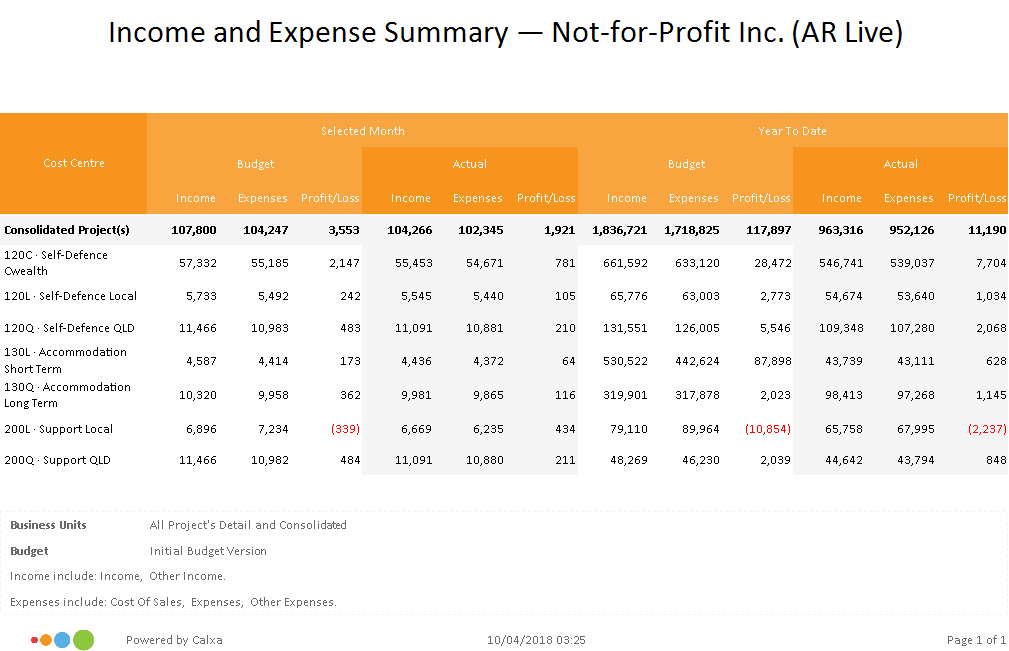
Business Unit Income to Expense Summary
In this mode, you have just as much creative freedom as you do when making any other page with the Divi Builder. See The Builder Overview.
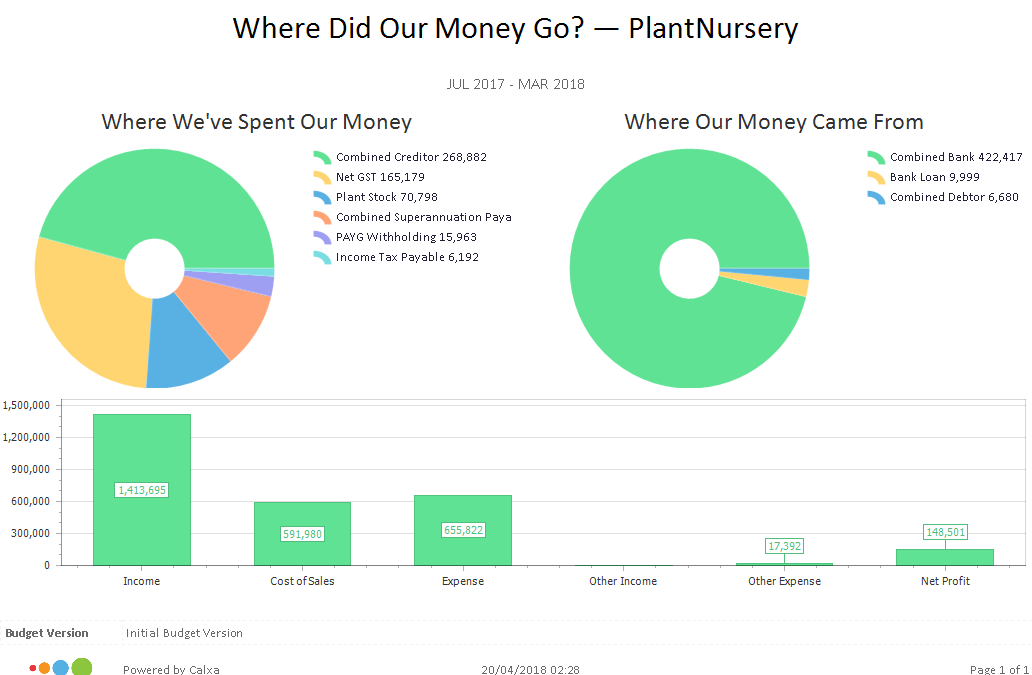
Where Did Our Money Go? Chart
How to use this report Non-accountants need to understand the connection between the net profit and the bank balance. See how the business has been funded and what the major outgoings have been – prepared ready for the lay...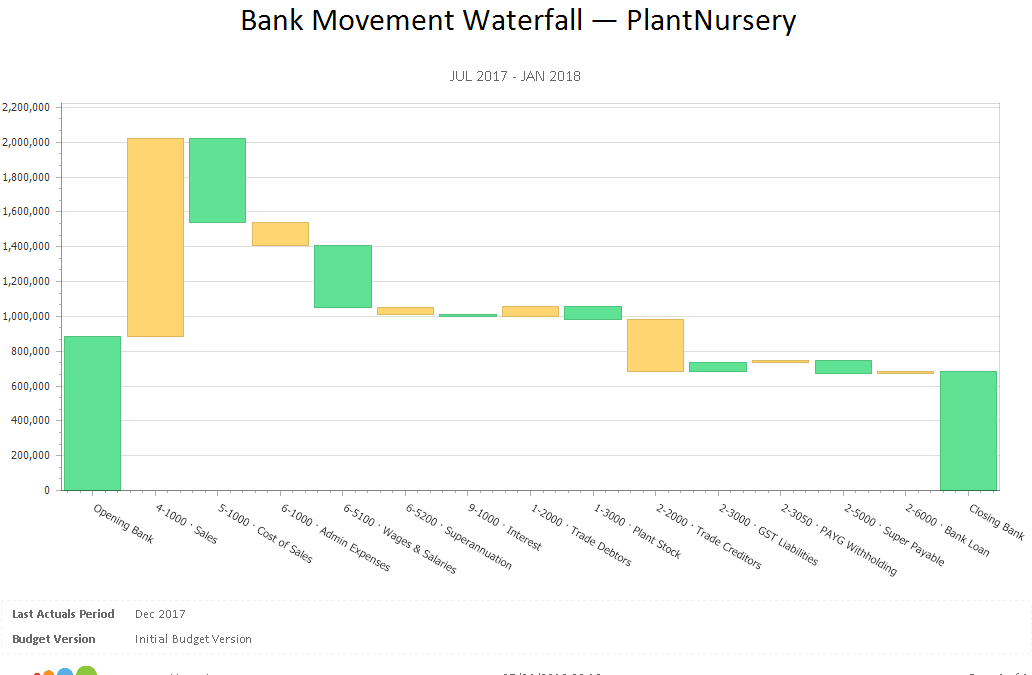
Bank Movement Waterfall Chart
This chart visually represents the cumulative effect of the positive and negative movements on your bank balance. Each bar starts at the position the previous bar finished thus showing the cumulative effect of the inflows and outflows.