Calxa Resources
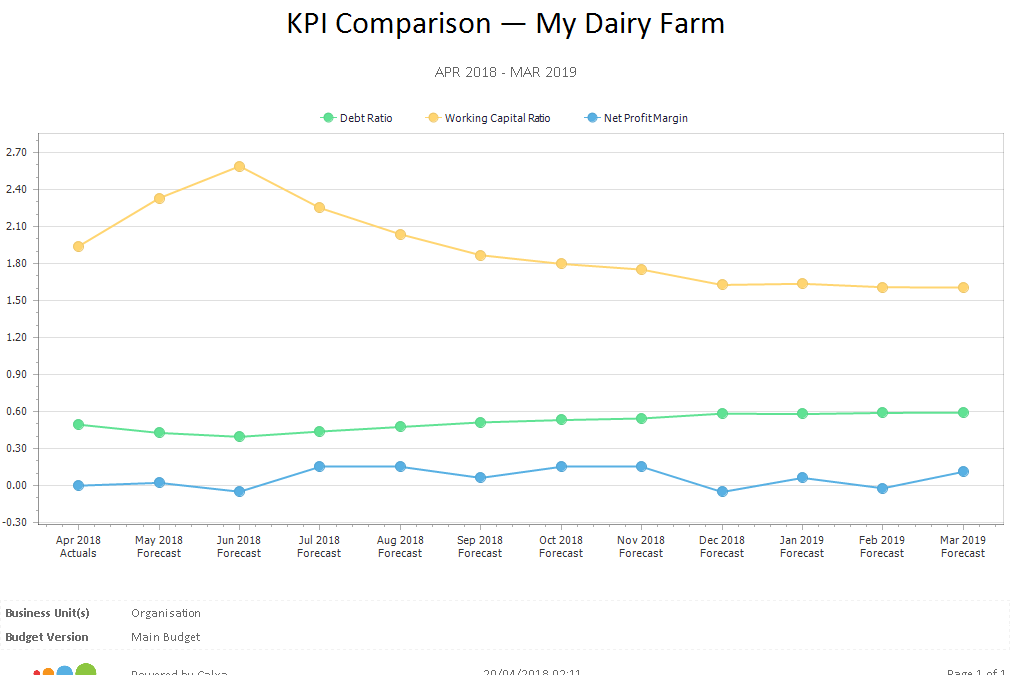
KPI for Dairy Farmers
About this report Combine financial data with non-financial Metrics to create KPIs to track what really drives your business. Whether you are in dairy farming or another branch of agriculture, there will be key numbers that help you understand your...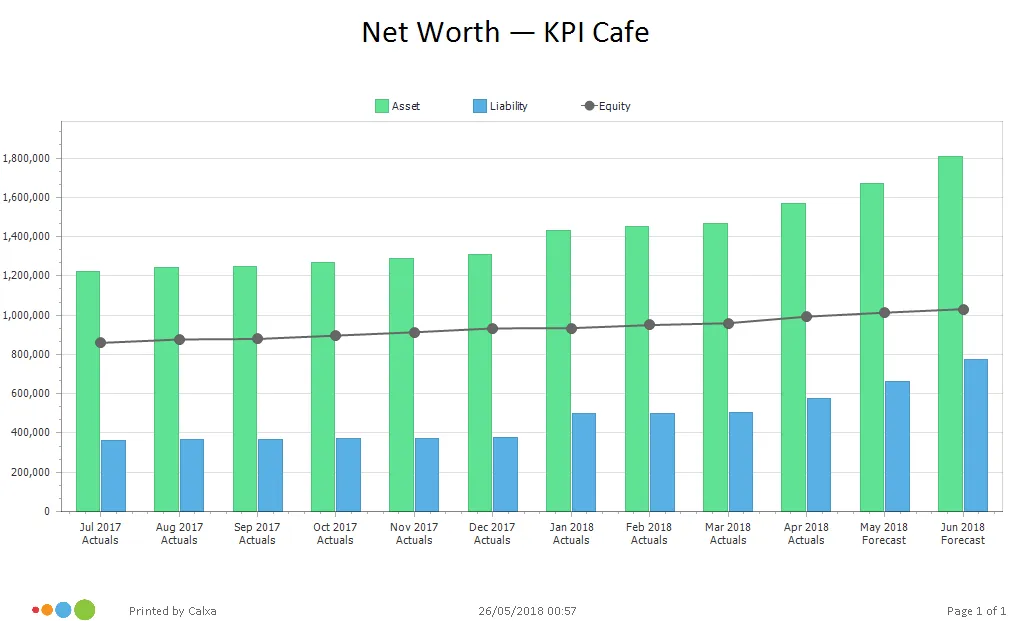
Net Worth Chart
How to use this report This simple chart tracks your total assets and liabilities for the past months and projects them forward for the remainder of the year. The line shows your net worth – and you want that to be rising....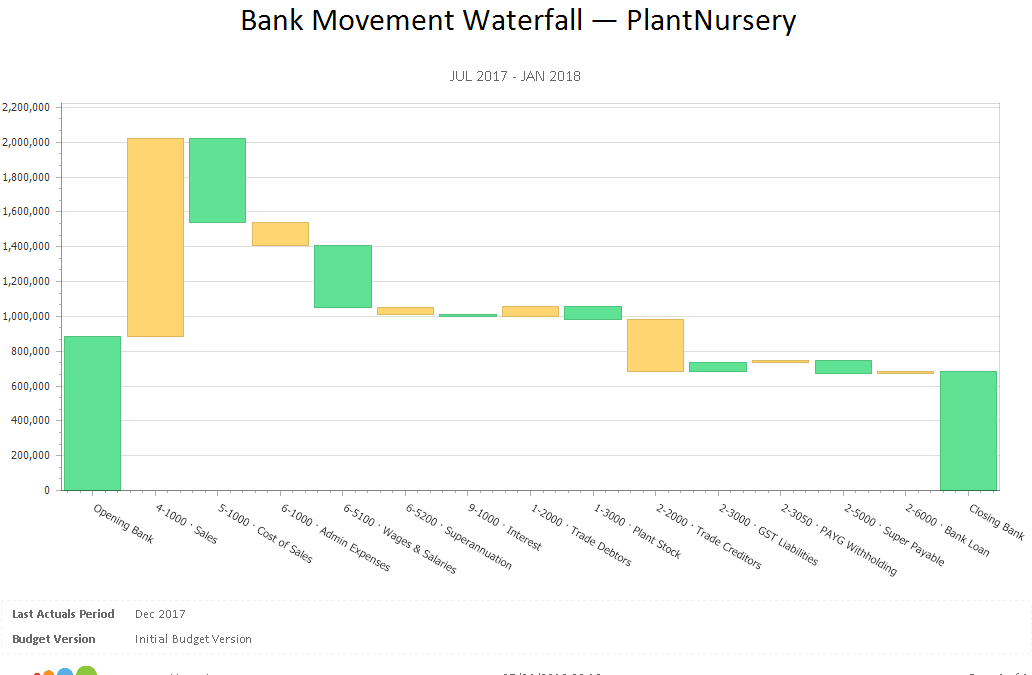
Bank Movement Waterfall Chart
This chart visually represents the cumulative effect of the positive and negative movements on your bank balance. Each bar starts at the position the previous bar finished thus showing the cumulative effect of the inflows and outflows.