
Predicting the value of your stock on hand and the associated movements in its value is an important part of cashflow management for any inventory-based business. Especially in a seasonal business, it’s common to simply replicate the previous year movements and assume that this year’s will be the same. That will work if nothing substantial has changed, but what if you have been adopting a strategy of actively managing your inventory turnover?
If you have been monitoring the fluctuations in your inventory turnover days KPI and you are then working to reduce it, it makes sense to use that as the driver of your stock movement calculations. Let’s look at how we can do that in Calxa.
What’s Inventory Turnover Days?
This ratio tells you how long your stock is sitting on the shelf between purchasing products and them being sold. It is also referred to as the average number of days of stock on hand.
Calxa provides Inventory Turnover Days as a standard KPI. This looks at the current inventory value, the closing balance of the inventory account, then divides it by the annual cost of sales and multiplies it by 365. The calculation looks like this:
(Inventory/Annual COS) x 365 Days.
Doing it this way, smooths out the monthly variations.
However, averaging stock across a whole year is not useful for businesses with a fluctuating trade. In these cases, we need to adjust the Inventory Turnover Days to cater for this seasonality and adjust the formula to:
(Inventory/Monthly COS) x 30.
For our current purposes, rather than reporting on the historical inventory turnover days, we’re going to use it as a driver or predictor of stock movements and closing stock levels.
How to Add these Metrics and Budget Formulas
Firstly you need to create some metrics and pair them with some budget formulas across the relevant period you want to plan for.
NOTE: Set all Metrics up as Type = Movement (Sum)
TIP: Add a separate group for these metrics to make it easy to find them.
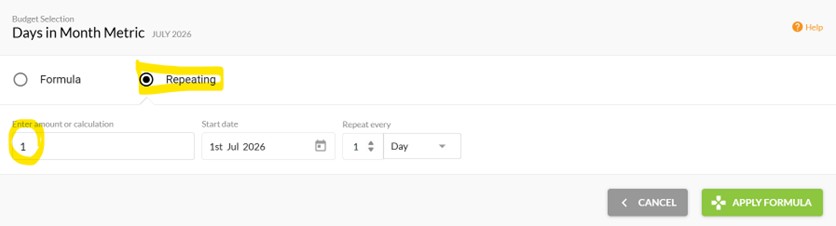
1. Days in Month – the number or days in each month.
Use a repeating formula to calculate the number of days each month.
2. Inventory Turnover Days
Budget for your expected turnover days each month against this metric. This is the one that will drive the calculation of the closing stock.
3. Cost of Sales
While not strictly necessary, adding this as a metric and referencing the Cost of Sales account budget can make it easier to see all parts of the calculation together. The account budget will typically be set as a percentage of revenue.
4. Daily COS
Now you can calculate Daily COS using this budget formula:
Cost of Sales/Days in Month.
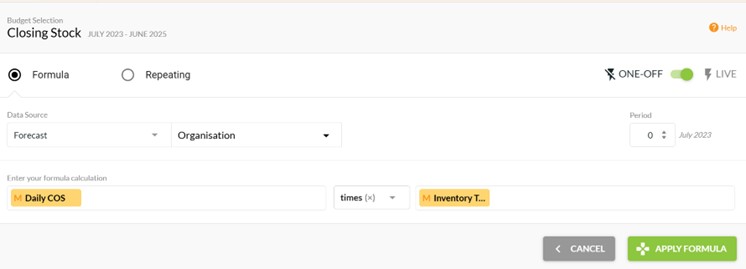
5. Closing Stock
This is simply calculated from Daily COS x Inventory Turnover Days.
6. Opening Stock
The formula use the Closing Stock for Period -1, the previous month.
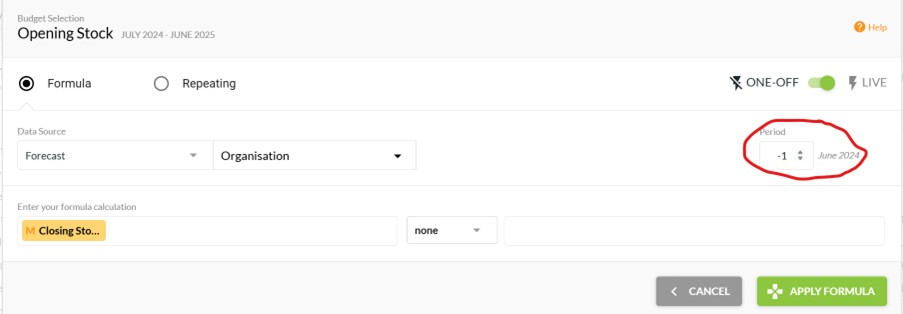
NOTE: For the very first month of your budgeting period, you’ll need to manually populate the Closing Stock metric from a Balance Sheet report.
7. Stock Movement
Finally, this metric uses a budget formula referencing the previous two metrics : Closing Stock – Opening Stock.
The accounts budget on the Inventory account in the balance sheet will then reference this metric. Again, you could skip this metric and do this calculation directly in the account budget.
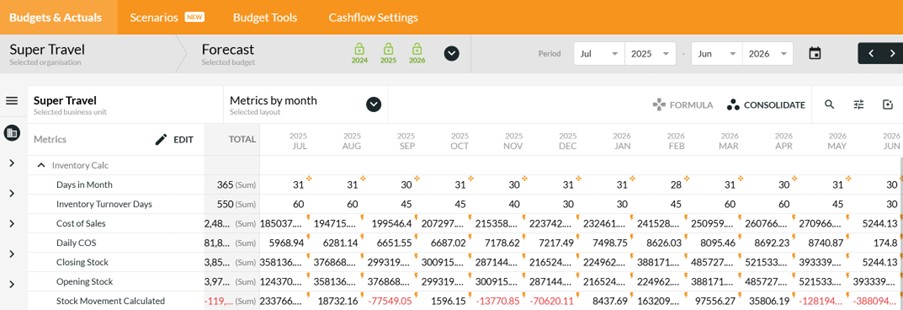
Conclusion
Your final metrics budget will look something like this:
As with many aspects of budgeting and management reporting, there’s more than one way to budget for your inventory movements. Our help article gives options based on the previous year movements and also a calculation based on expected purchases. Working from Inventory Turnover Days is another option that will suit those actively managing stock levels.
If yours is a seasonal business, you may want to read our Seasonal Cash Flow: Strategies to Manage the Ups and Downs.