Spotlight Reporting vs Calxa is a look at 2 of the leading solutions for Xero or QuickBooks users. We recently featured both in our Top 5 Xero Cash Flow Alternatives article. How do you pick the best cash flow forecasting software for your clients or business? We get asked this question often. So, we decided to have a closer look and pen this article to help our readers assess their options.
Spotlight Reporting vs Calxa – the Quick Summary
In many ways, it is clear that Spotlight Reporting was created by accountants for accountants in practice. In comparison, Calxa’s design favours management reporting for accountants and non-accountants alike. Some of the give-aways here are the terminology used. In the Spotlight Reporting app, accounts are grouped in a way accountants would traditionally present statutory reports. Calxa, on the other hand, starts from your own chart of accounts in Xero or QuickBooks Online and gives the ability to group and summarise that information the way that suits your business reporting needs.
While the depth and range of reports is greater in Calxa, Spotlight does shine in adding multiple charts to a page (the Calxa team says, “watch this space”!) and placeholders for Executive Summary text. Calxa’s strength is the flexibility of its reporting, especially for cost centres and multi-currency consolidations.
While the feature-by-feature comparison makes these 2 tools look very similar, there are big differences in the detail.
| Reporting Requirements | Spotlight Reporting | Calxa |
| Accounting System Budgets | Yes | Yes |
| Import Spreadsheet Budgets | No | Yes |
| Driver-based Budgets | In Forecast | Yes |
| Balance Sheet Budgets | Yes | Yes |
| Cost Centre Budgets | No | Yes |
| 3-Way Forecasts | Yes | Yes |
| Multiple Company Consolidations | Yes | Yes |
| Multi-Currency Reporting | Yes | Yes |
| Loan Calculator | Yes | Yes |
Spotlight Reporting vs Calxa for Budgets
In Calxa, you can enter, or import, one or more budgets for an organisation. You can then use that budget for any forecasting or reporting need. Here, Spotlight Reporting takes a different approach and strictly separates reports, forecasts and dashboards. This means that you need to not just re-connect and re-import your accounting data, but also re-create your budget in each module. There is no option to use your reporting data in a forecast, or vice-versa.
Where Calxa has formulas for budgets, Spotlight has dynamic rules. There is some overlap between the 2. For example, increasing a budget by x% per month is easily done in both apps. Also, each software supports driver-based formulas. Again, Calxa gives you more flexibility in the choice of data source for the formulas, in the date ranges to be used and combinations of drivers, accounts and numbers that can be used.
How Does Cashflow Forecasting Compare?
The structure of cashflow forecasts is quite different in Calxa and Spotlight Reporting so moving from one to the other can be challenging.
Essentially, Spotlight Reporting has just one data source per forecast which works well if you are using Xero budgets or entering the budgets directly into the app. If your existing budget is in a spreadsheet though, you will need to re-type that to use it. In contrast, this is easily imported to Calxa.
The rules in Spotlight Reporting include timing options for payments and receipts. Where this is very useful is the flexibility it provides in creating forecasts with different payment rules. However, the downside is that you need to set up those rules again for each forecast you create.
This is handled quite differently in Calxa, where the app will automatically create payment profiles based on the actual average debtor days and creditor days in the accounting system. In Spotlight Reporting, you need to make your own assumptions on timing.
Both forecasting tools have schedules to manage the timing of tax and other payments. They both cover the main choices for both Australia and New Zealand taxation (disclaimer here: we haven’t tested all countries).
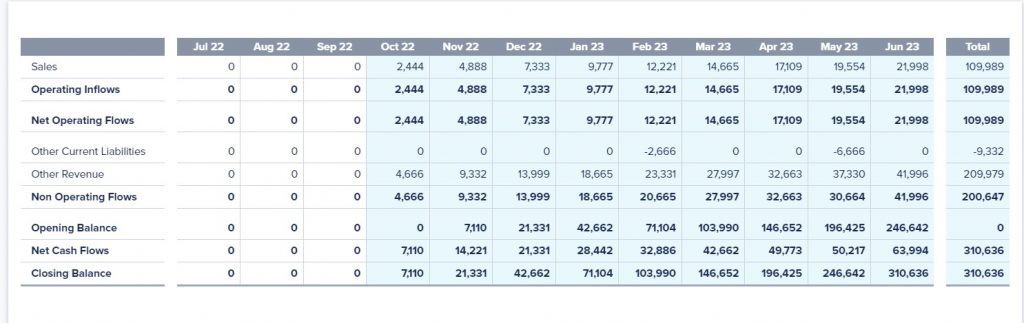
Report on Cash Flow from Spotlight Reporting
On a different note, Spotlight Reporting does have a clever calculator for end of year tax payments. It includes the option to incorporate prior year losses. This would have to be set manually in Calxa. It is worth noting that Spotlight Reporting assumes that all superannuation is paid on a quarterly basis in Australia which can be limiting.
Reporting on KPIs in Spotlight Reporting and Calxa
KPIs are an important part of any management report, and you can produce them with either of these tools. In some ways, the pros and cons follow the general philosophy of the apps.
With Calxa, you create KPIs once and can then use them with any organisation in that workspace. In Spotlight Reporting, you create them for each data source. Once again, this can involve more work. Looking at this from a different angle though, it may also reduce the clutter of seeing KPIs that aren’t needed for other organisations.
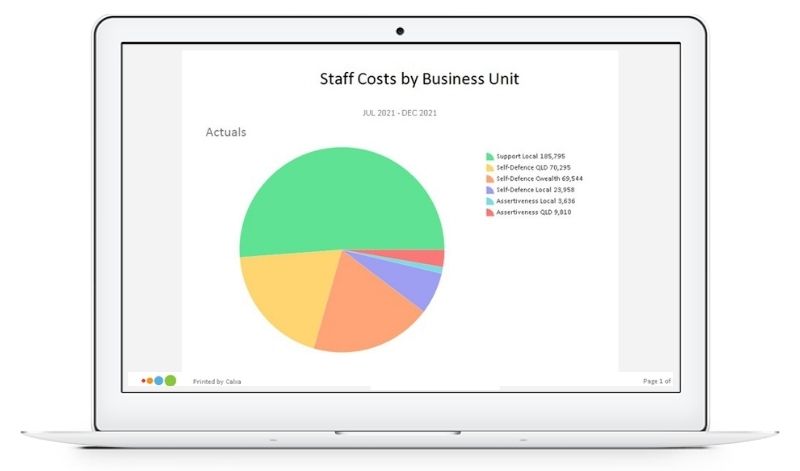
Calxa gives you the option of incorporating KPIs directly into most reports. This is not so in Spotlight Reporting. Here they are separate, but you can have multiple charts to a page, a distinct advantage over Calxa.
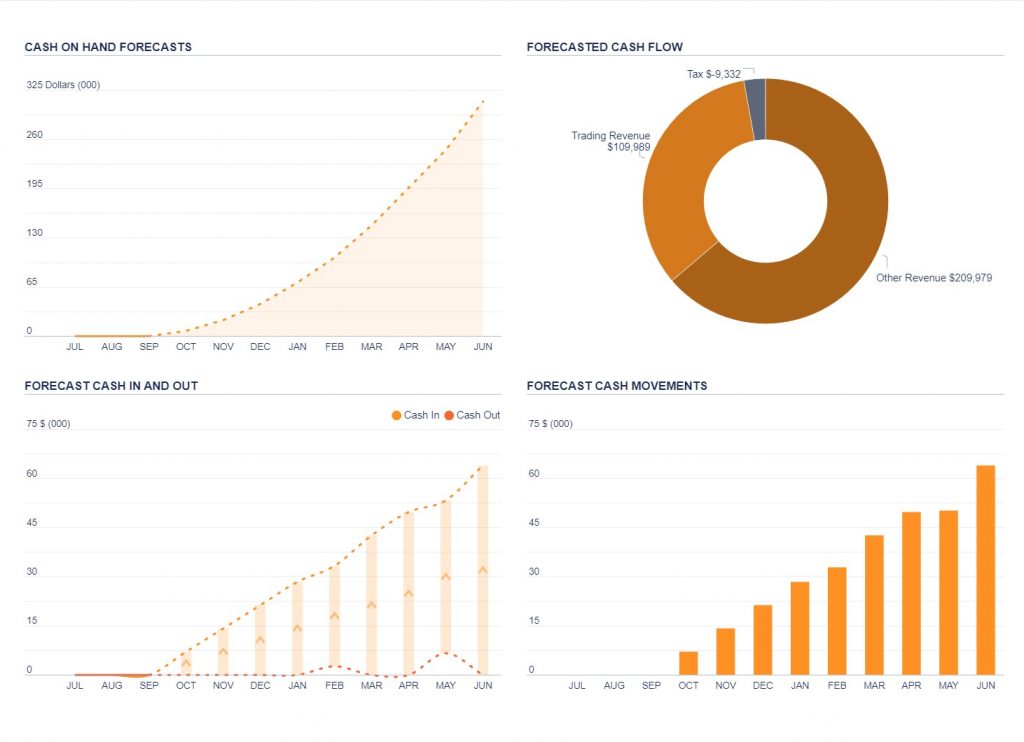
Multiple Charts on one Report using Spotlight Reporting
How do Spotlight Reporting and Calxa handle Consolidations?
Both Calxa and Spotlight Reporting will give you consolidated reports across multiple entities. As a starting point, both take a similar approach of connecting the individual companies and then creating a group.
While Calxa handles all 180 currencies, Spotlight Reporting offers around half available rates. In saying that, they do cover the world’s major currencies. Both allow you to edit the imported exchange rates to suit your needs.
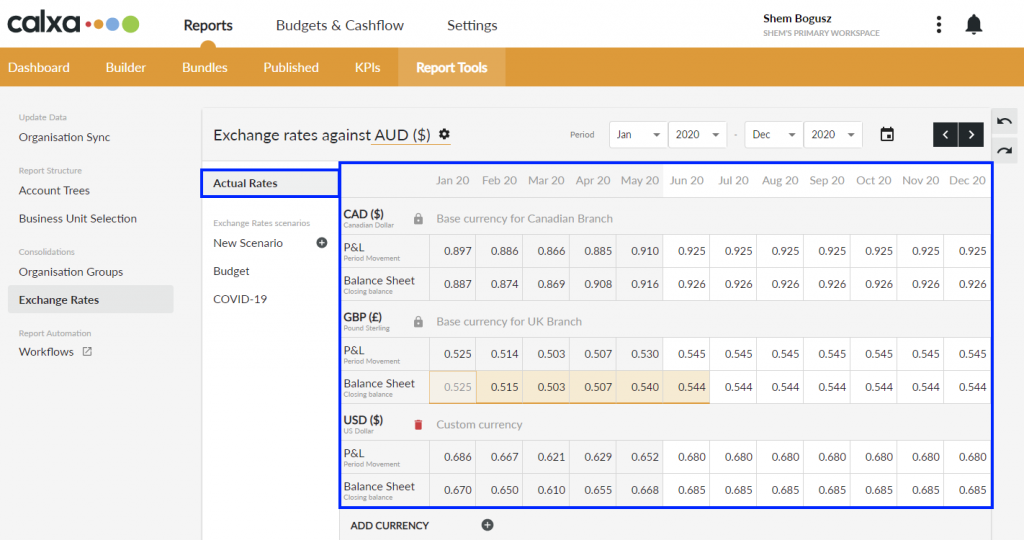
Select from 180 currencies for your consolidated reports in Calxa
Especially when you’re reporting on budgets, Calxa gives you a greater choice of multi-entity reports. Both do the basics of Profit & Loss, Balance Sheet and a Cashflow Forecast. On top of this, however, Calxa has the edge in the variety of layouts and flexibility of content.
Cost Centre Reporting compared in Calxa and Spotlight Reporting
Reporting on cost centres is something that Spotlight Reporting has introduced relatively recently. For budgets, the app relies exclusively on what you have entered in the accounting system. Essentially, the setup requires adding a new data source and re-importing from the accounting system for each cost centre or group that you want to report on. This might be fine if you only have a handful but would be tedious for those with more than that.
Calxa, on the other hand, was built from the ground up to do budgets and reports for cost centres. It is where its strength and flexibility lies. You get the full power of the budget builder with its formulas and drivers. You can view your budgets by tracking category or by account. When reporting, you can easily select one, all or any combination of cost centres. Report on them side by side, row by row, whichever way you want.
Reporting on Cost Centres for Single Account in Calxa
Spotlight Reporting vs Calxa for Accountants
As we mentioned at the beginning, Spotlight Reporting was designed by accountants in practice. The format and the grouping of accounts in the reports very much follow traditional reporting layouts. Calxa, on the other hand, is focussed on management reports and gives much more flexibility over the rows and sections in a report.
Both apps produce report packs – they’re called bundles in Calxa – of monthly reports that can be exported to PDF or Excel. Along with automating the synchronisation of data with Xero or QuickBooks, Calxa will additionally schedule delivery of report bundles as an email attachment.
While both give the option of a cover page and executive summary, Spotlight has more templated text to simplify the writing. It also has a great system of placeholders that allow the inserting of dynamic text.
Comparing Not-for-Profit Reporting
While Spotlight is used by some charities and not-for-profits, it has some limitations in what it can do. There are some NFP report templates and KPIs built in, but the thinner serving of its cost centre budgeting and reporting seriously restricts its use in this sector.
On the other hand, Calxa has been the leading reporting tool for Not-for-Profits in Australia and New Zealand for many years and is growing in popularity in the UK and other countries. This isn’t just because of the power of the cost centre budgets and reports. It is due to the inclusion of reports designed for the sector such as the Unspent Budget reports and more.
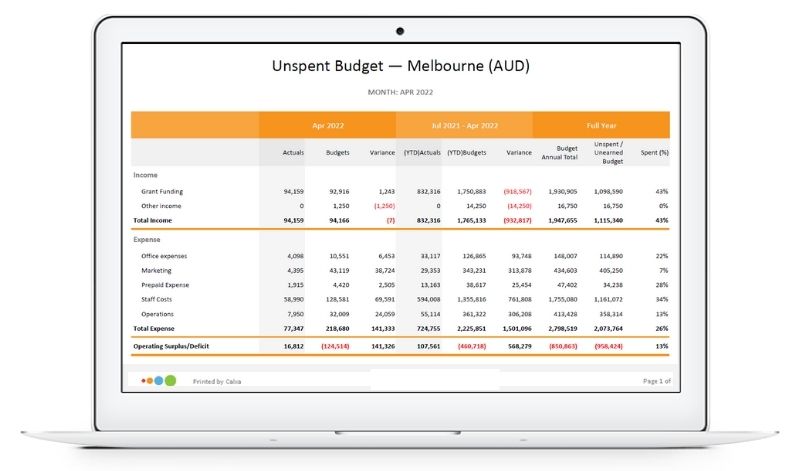
Unspent Funding Report in Calxa
Final Summary
Spotlight Reporting does what it says on the box: reporting. Calxa was built around budgets and cost centres and that shows in its depth in those areas.
As with most of these decisions, the first thing you need to understand is your own requirements.
- Do you need cost centre budgets and reports? Then Calxa is the clear leader.
- Is it essential you have placeholders to help automate an executive summary? Then, Spotlight comes out on top there.
For the rest, you should do your due diligence and match the pros and cons to your needs. Both tools have their fans and sometimes it does come down to personal preference or prior exposure. Some prefer the look of the Calxa reports and charts, some like the more traditional look of the Spotlight Insights.

Note from the Calxa Team
It is not uncommon for our new and existing Calxa customers to ask us how we compare to other apps. This prompted us to have a closer look at a number of Xero & QuickBooks Online Cash Flow Tools.
The review was split across various members of the Calxa Team. We then collected this data and summarised it to create a series of comparison-style content. These articles are designed to be helpful when you are evaluating functionality of a Cashflow App.
We want to acknowledge that the world around us moves fast and changes are inevitable. Of course, technology developers make improvements to their apps all the time. This means, that some of our discussion may be outdated by the time you read this.
So, please, keep this in mind when you digest this article. It simply reflects our point of view at the time of evaluating these apps.