Calxa Resources
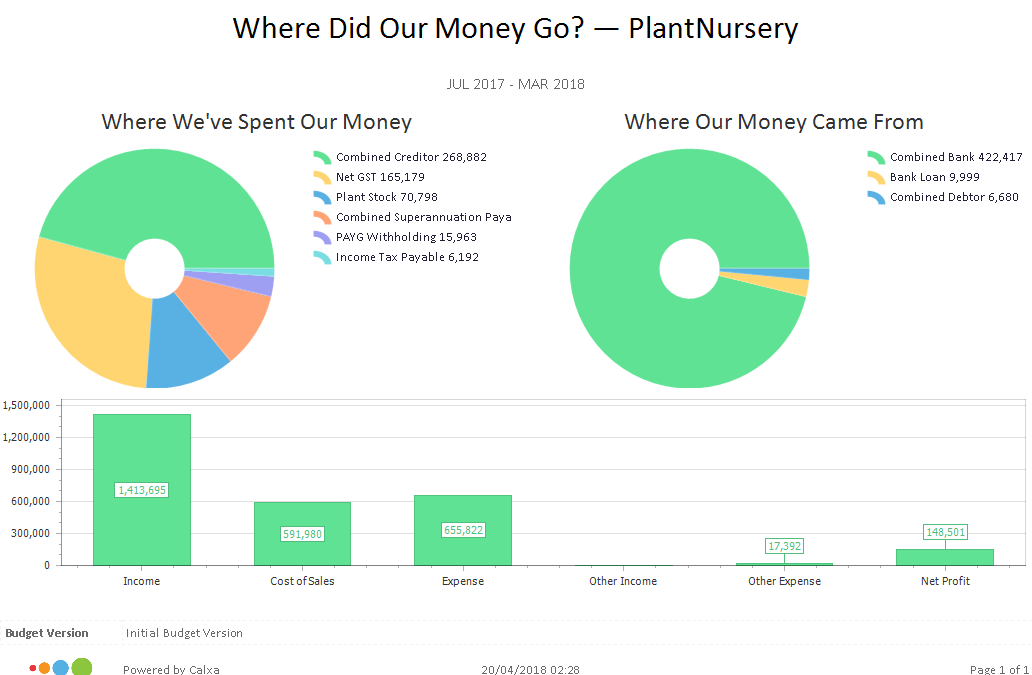
Where Did Our Money Go? Chart
How to use this report Non-accountants need to understand the connection between the net profit and the bank balance. See how the business has been funded and what the major outgoings have been – prepared ready for the lay...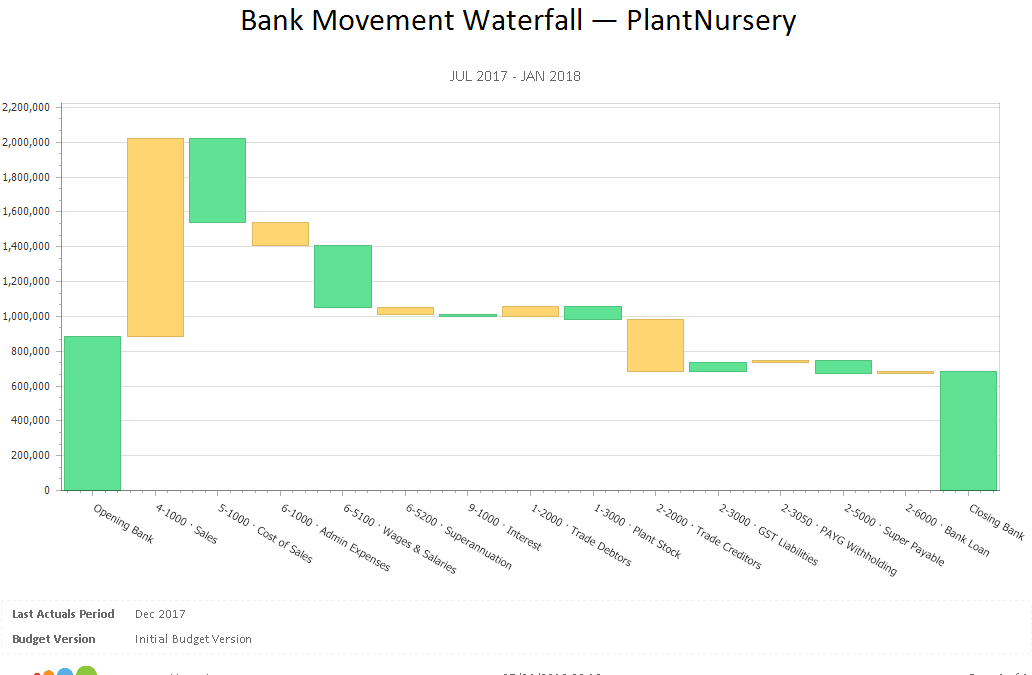
Bank Movement Waterfall Chart
This chart visually represents the cumulative effect of the positive and negative movements on your bank balance. Each bar starts at the position the previous bar finished thus showing the cumulative effect of the inflows and outflows.
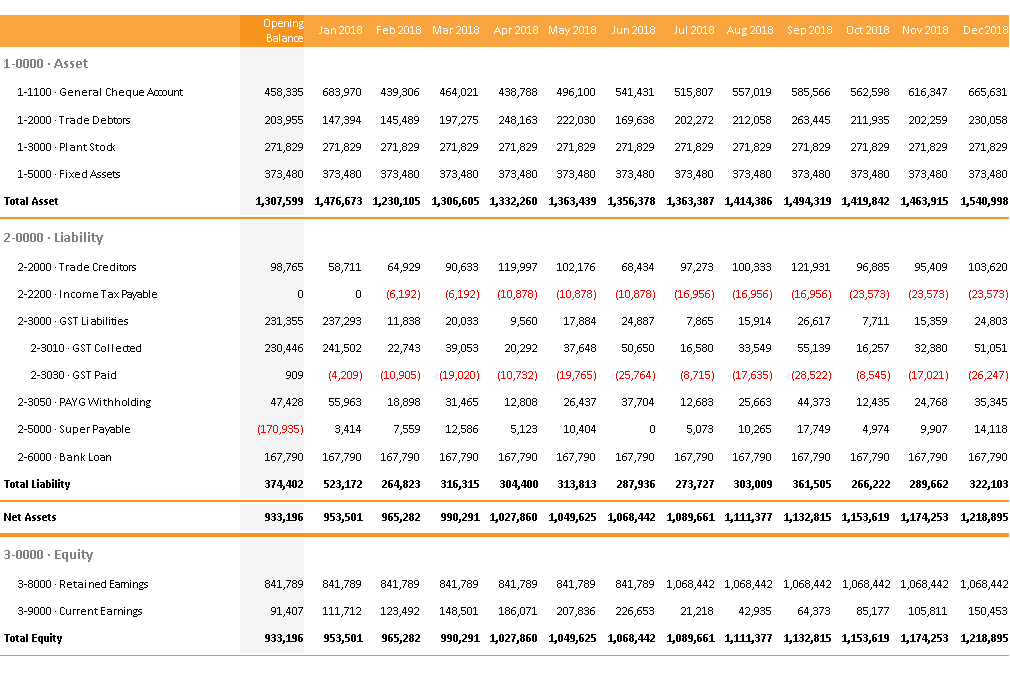
Balance Sheet Forecast Calxa Report
How to use the Balance Sheet Forecast report Project your Balance Sheet forward for 1 or more years to get a clear idea of where your business is heading. Identify potential problems before they...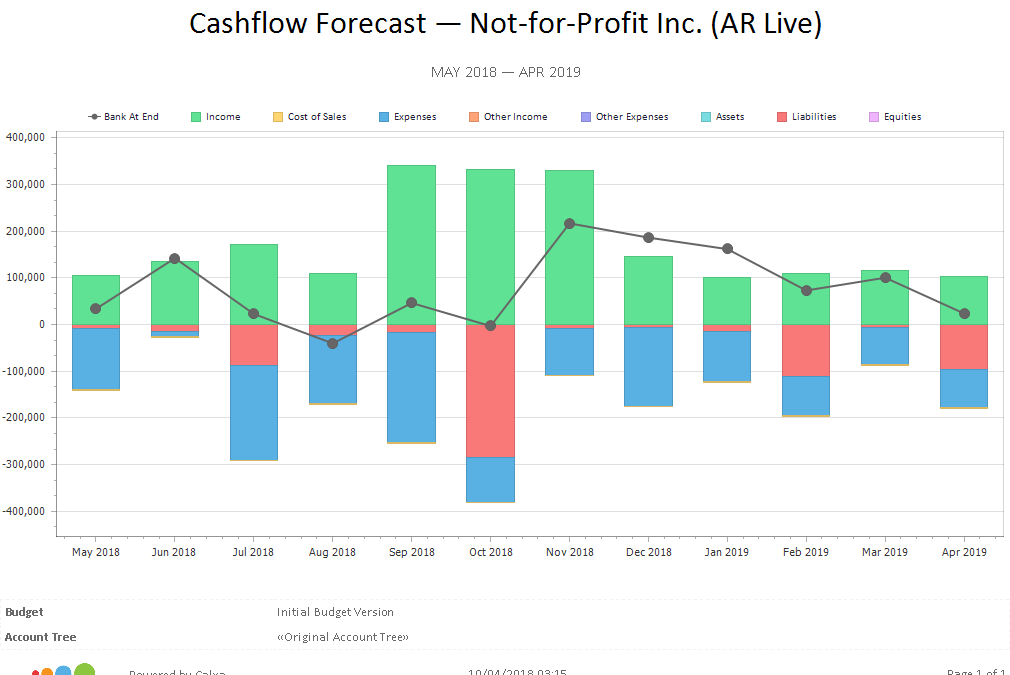
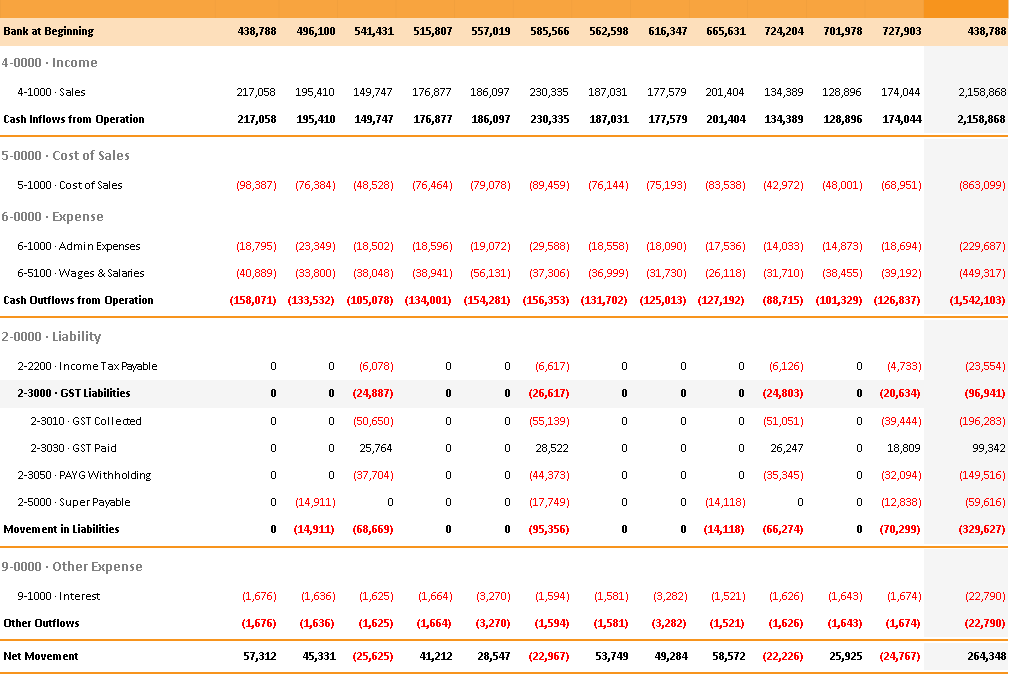
Cashflow Forecast Chart
One of the most important reports any business should run on a regular basis. It shows the bank balance looking forward to highlight upcoming tight spots. Displaying the bank balance line across the bars sectioned into income, expenses, assets and liabilities it gives a good idea of what drives the cash.