
Calxa Resources
Fact Sheet for Business
The Invisible Accountant Fact Sheet
The Invisible Accountant Fact Sheet The Invisible Accountant is a creation of the Calxa Team. It’s the first pure cloud product the team launched in late 2017. Using Calxa’s innovative reporting engine, The Invisible Accountant is designed to automatically...
Fact Sheet for Not-for-Profits
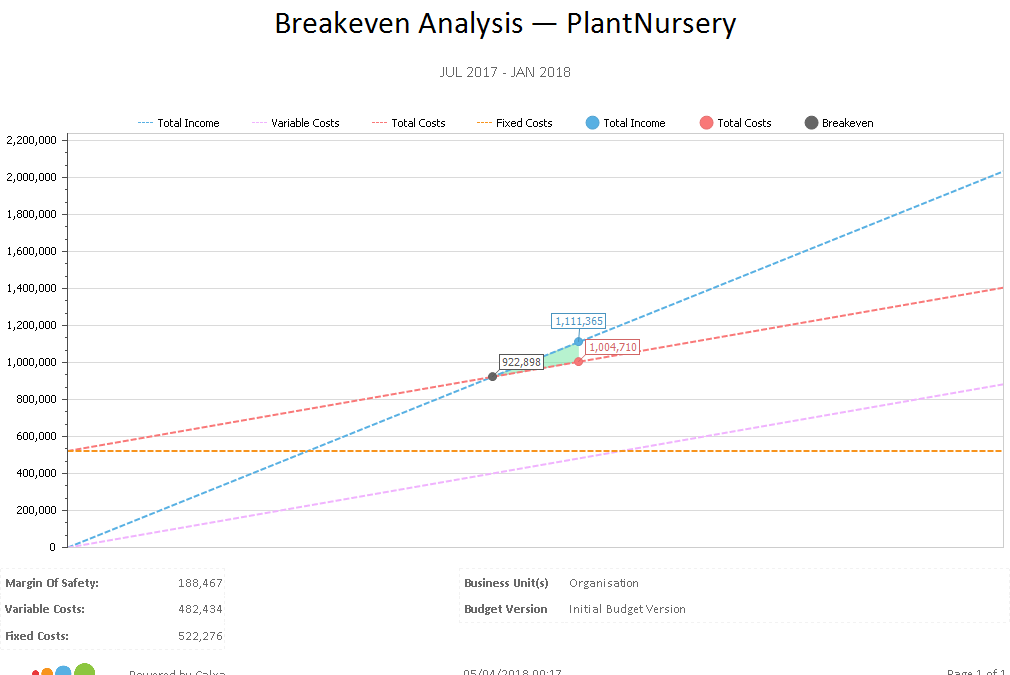
Breakeven Analysis Chart
Show cost centre managers just the detail they need to get the job done. In this example that’s one cost centre and just the expenses that the manager controls. Quickly see what has been allocated and what’s left to spend.