It is time to contemplate what to include in your end of year reporting. It is a good time to both look to the future and review the past through your financial reports. Some reports will give you the information that you need to see how well your business has done. Others will document your plans. Have a look at our suggestions and pick the ones that make most sense to you.
Your End of Year Report Kit
We have put together a list of what we feel will make for a good end of year reporting pack for your organisation.
Reports for reviewing the past year:
- Budget Analysis
- Profit and Loss with Projected Total
- Where Did Our Money Go?
- 5-Year Overview
Reports for planning the year ahead:
- P&L with Projected Total
- Cash Flow Forecast & Cash Flow Scenarios
- Balance Sheet Forecast
All financial reports benefit from context. Numbers in isolation often do not confer any meaning. If we told you that someone had income of $100,000 would you be able to say whether that was good or bad? Knowing that their expenses were $80,000 or $120,000 would add some context. So would knowing that the previous year their income was $50,000 (or $500,000). If they had set a budget at the beginning of the year of $60,000 you would say they have done well. If the budget was $150,000, then that’s not so good.
When you’re producing financial reports, especially if your audience is not so financially literate, give them something to compare the numbers to. As a result, including that comparison will help them make assessments of how good (or bad) the number is.
EoY Reports to Review the Past Year
Let us start with the past. Firstly, make some decisions on the reports you want to include based on Proft & Loss and/or Balance Sheet.
Profit & Loss Reports for the End of Year
When reporting on the year just gone, the most common comparisons are to the year before or to the budget for the year. Neither is better than the other; they just tell a different story and, ultimately, you are trying to tell a story with the numbers that you present to your audience.
That story may be that you did well (in some areas) compared to the previous year or that you did better (or worse) than the initial budget. By understanding that context, your audience will be able to make an assessment on the importance of particular variances. It usually helps to supplement numbers with words and commentary. Those members of your team who are closely involved may be aware of reasons for the major variances, but is that the case for board members, for example? Providing more information on why things haven’t worked out as planned is a proactive way of keeping people informed.
So, our general advice on reviewing the year just gone is to include reports that show:
- A comparison to the original budget as this is what the board signed off on,
- A comparison to the year before,
- A multi-year comparison showing trends over the last 5-10 years,
- Monthly trends for the year, not just the annual total
- Use KPIs to show changes in the important numbers for your organisation
- Provide a mix of charts and reports with numbers
Balance Sheet Reports for the End of Year
When most people think of end of year reports, they focus almost exclusively on profit and loss type reports. Our humble opinion is that this misses much of what is happening to the organisation.
Start by comparing the Balance Sheet at the end of the year to the same period last year. Have your assets grown or decreased? How have your liabilities changed? While not as immediately obvious to non-accountants, this can tell an important story about the fortunes of your business. Look at the big numbers first and then work your way down the list.
Consider things like your cash reserves. There was a time when we would ask the hypothetical question, “how long would your business last if your income suddenly stopped?”. One thing the recent pandemic and other crises taught us was that this is no longer a hypothetical question. The world can change very suddenly and there is no easy way of predicting that change.
Example End of Year Reporting for the Past
The combination of these four reports will give you a good start in reviewing the past year.
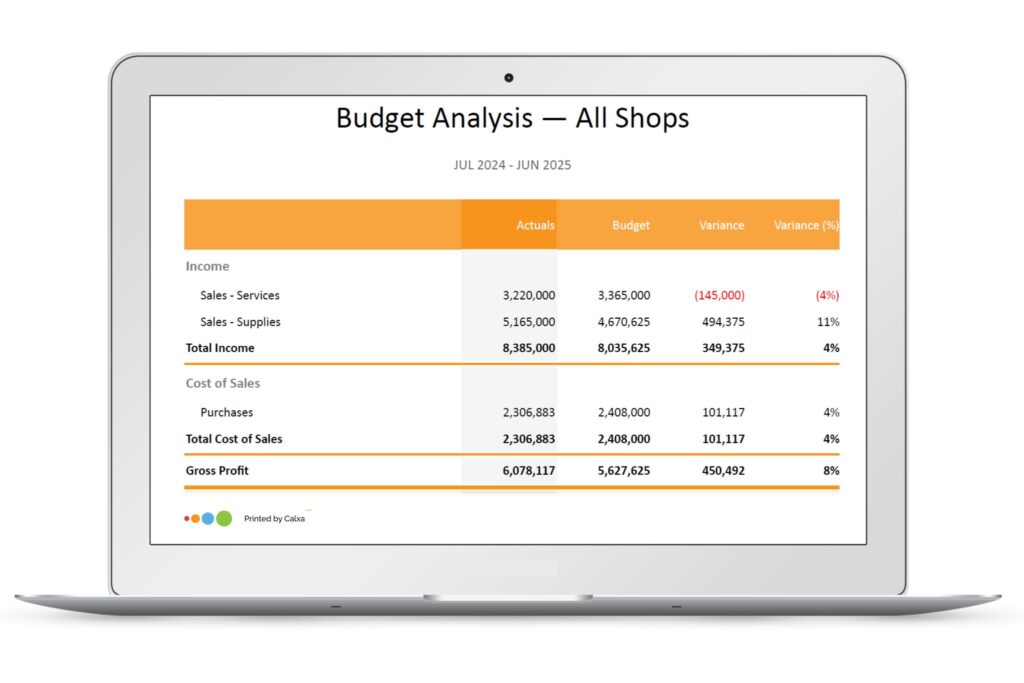
1. Budget Analysis Report
A budget analysis report gives a good snapshot for the whole year. It compares actual to budget variances. During the year use Actual vs Budget reports, which have a bit more detail. Use an Account Tree to summarise the rows in your Budget Analysis Report. Because you’ve had the detail all year, a more concise version usually will do the job now. Run a budget analysis report for a consolidated group of entities, just one organisation, a project or group of projects depending on your audience.
For a comparison to the previous year actuals, use the P&L vs Prior Period.
2. Profit & Loss Report with Projected Total
This is a great report to see each month column by column so you can review the trends in each line. Use the “Start Last Financial Year” date option in Calxa when creating this report and add some KPIs to the bottom (or in your Account Tree) for deeper insights.
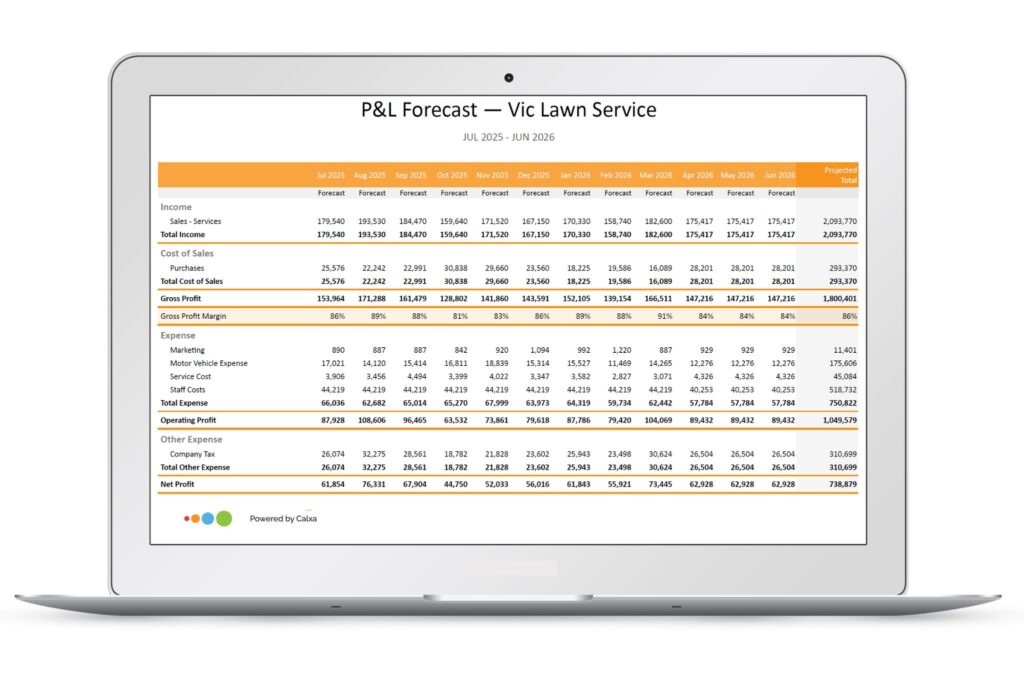
This is a useful report for looking back and understanding the monthly trends in your activity. You’ll see the highs and lows over the year. Use something like the Account Analysis Line Chart to see sections graphically, comparing either to budget or the previous year.
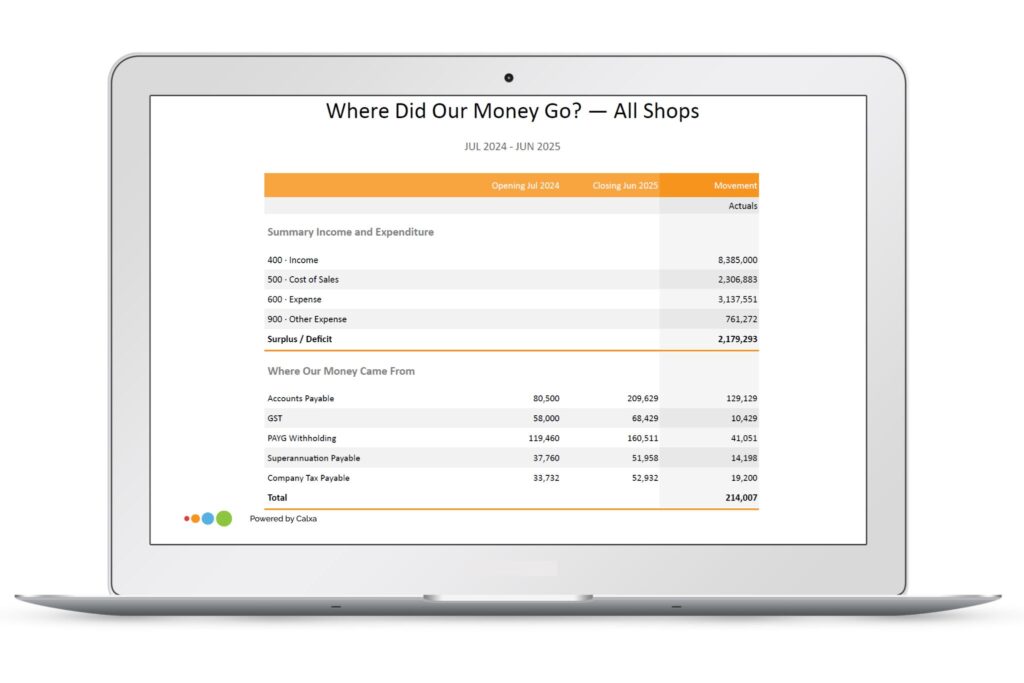
3. Where Did Our Money Go?
Run our popular Where Did Our Money Go report for a year and the Bank Movement Waterfall chart for a great overview of cash movements. Use Account Trees at level 1 or 2 for the Bank Movement so you don’t drown in the details. These provide a good way of presenting Balance Sheet changes that are understandable to non-accountants.
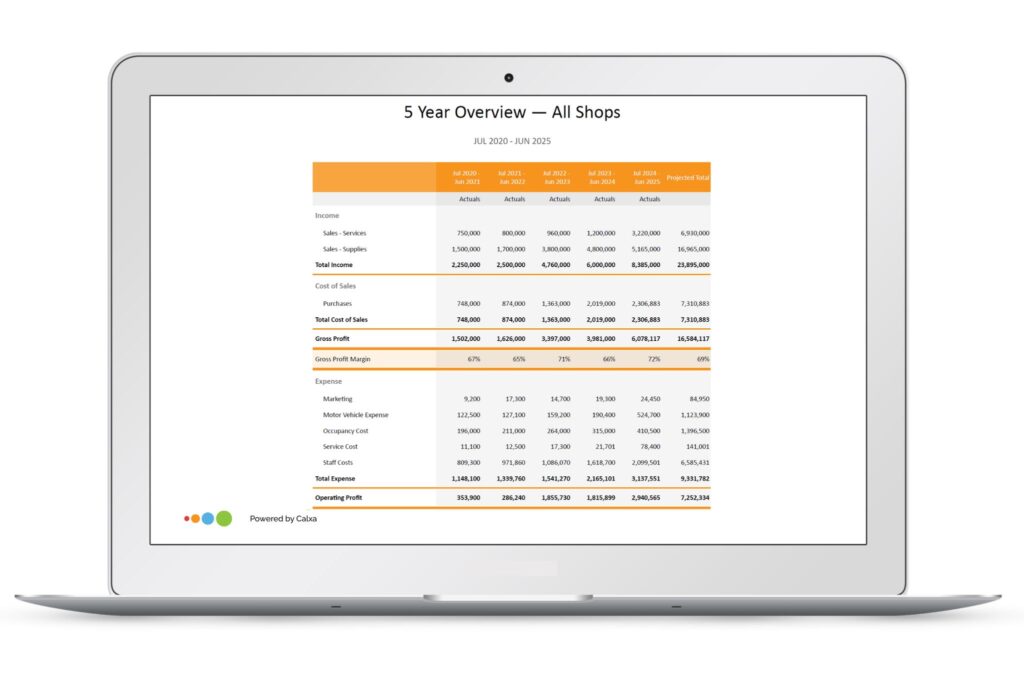
4. 5-Year Overview
There’s no better time to take a long view of your business and 5 years is a good timeframe. The Profit & Loss with Projected Total Report has an option that gives you 5 years (or 10 if you have that much data – and that could be 5 years in the past and 5 in the future). Set the start period to Custom and FY Start -60.
For something a little different, show just KPIs and not accounts. An annual perspective on your KPIs can often provide good insights into what’s improving and what needs more work. It’s easy to get caught up in short-term results and miss the longer-term trends.
End of Year Reporting to Plan for the Future
To plan for the future, it is now the time to run that famous “3-way forecast” that your accountant and bank manager love.
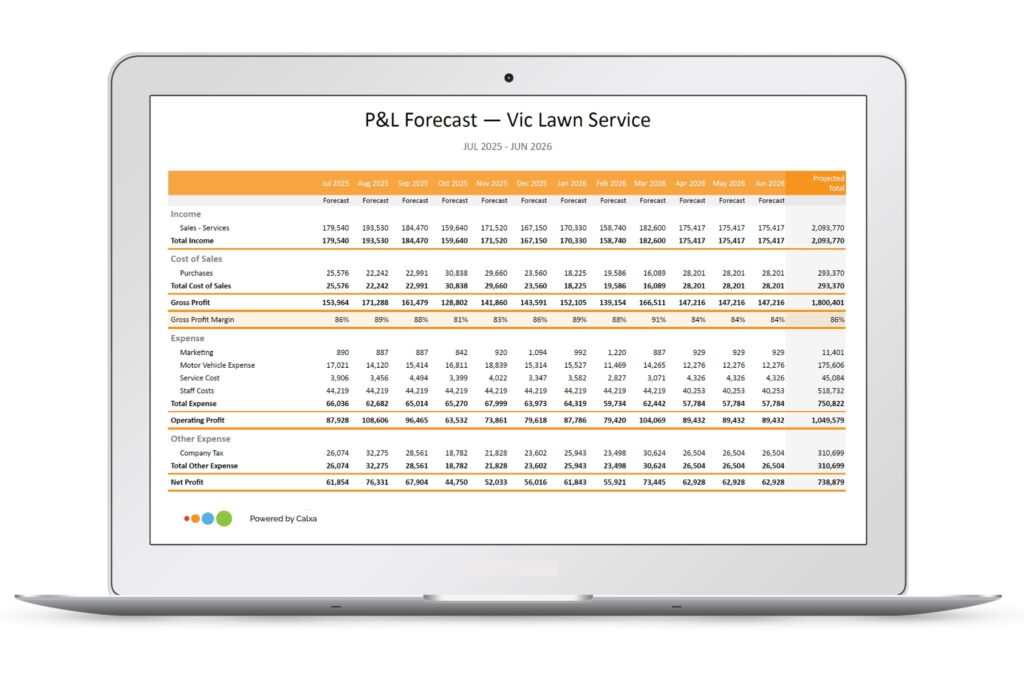
1. P&L with Projected Total
This is just like the one used to review the past year, but this time don’t show actuals, just budgets for the coming year. Use this report to communicate to the whole team what the plans are for your business moving forward. Set the Start Period for the report to Rolling Forecast to get your next 12 months.
For an alternative with a comparison to the previous year actuals, use the P&L vs Last Year Budget (12 months) report. That will show your forecast for the year compared to the actual result for the year just finished.
Tip: If you run this before the end of the year, set the filter to “Start Next Financial Year”.
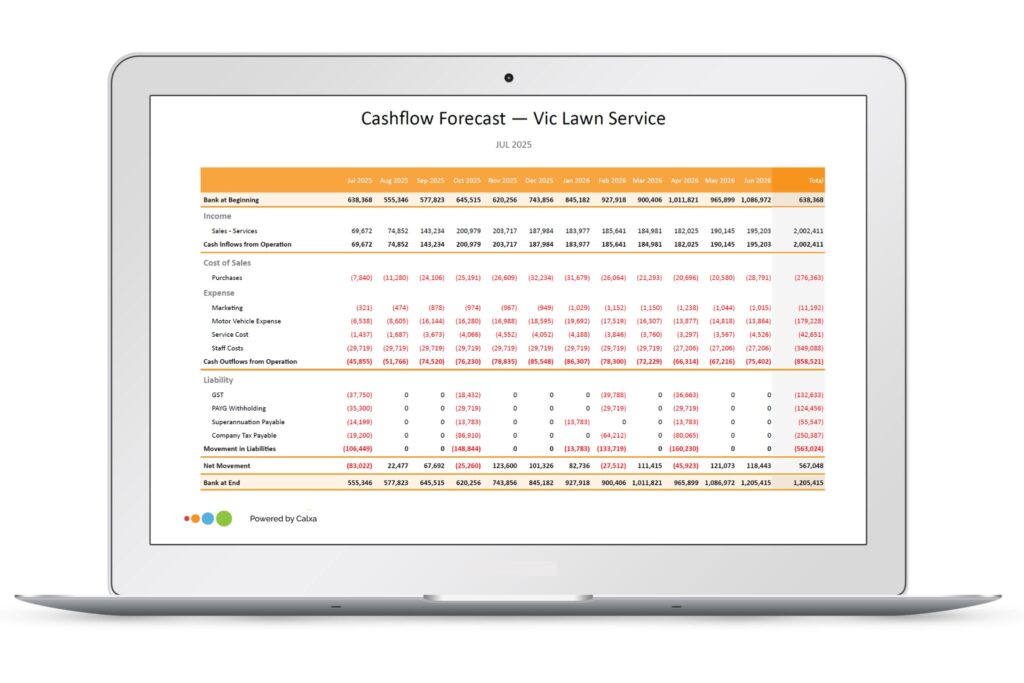
2. Cash Flow Forecast
It’s always cash flow forecasting time in our office but if it’s not one of your habits, this is a perfect time to start. Use a cash flow forecast to drive your business forward and make it a key part of your decision-making.
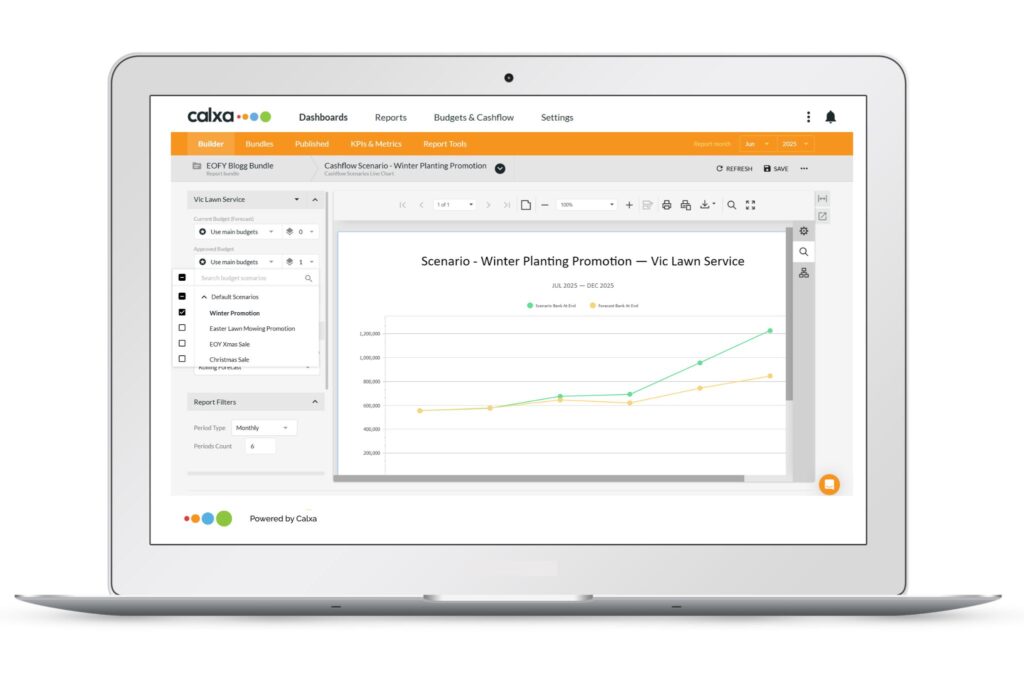
If you’re working on multiple scenarios for the next 12 months, use the Cashflow Scenario Chart to compare the possible effect on your bank.
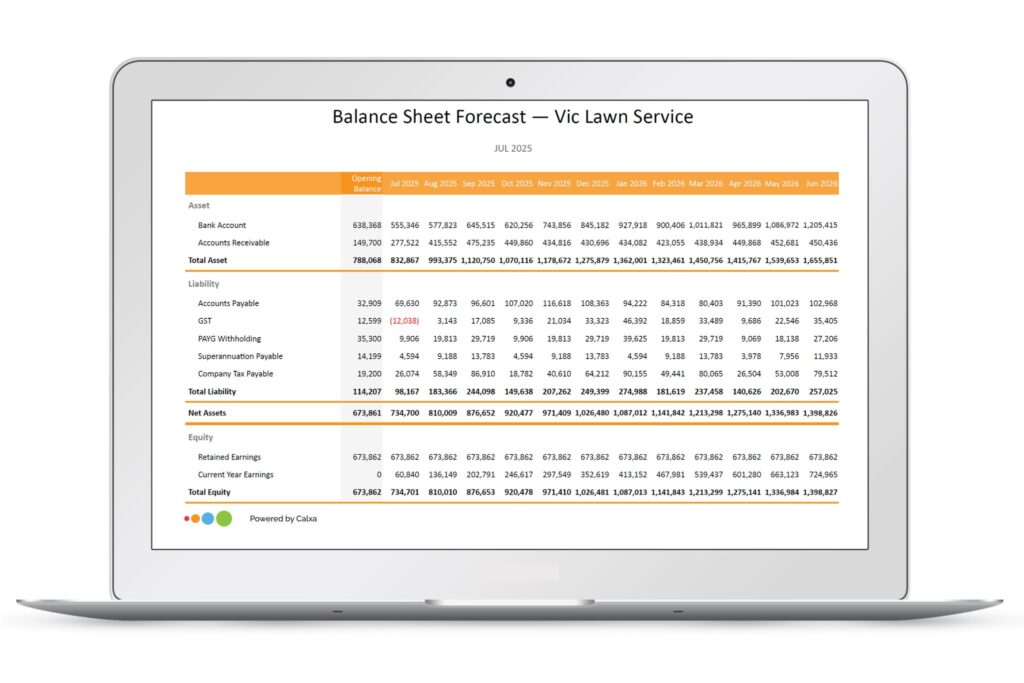
3. Balance Sheet Forecast
This completes the three reports of a 3-way forecast and will show your balance sheet movements for the next 12 months. The main question to ask when analysing this forecast is “Does it look reasonable?”. You’ll see where your debtors, creditors and other balance sheet accounts will change in the coming year.
Build your Own Reports to Suit Your Organisation
While these standard report templates will suit most businesses or Not-for-Profits, there’s always some who need something a little different. That’s why we provide you with the Dynamic Report Builder so you can choose exactly the columns you need. Combine actuals and budgets across different date ranges or different business units to get the insights that your audience needs.
A dynamic template with an Account Tree gives you flexibility in both the columns and rows of your reports.
Bundle your End of Year Reporting
We recommend that you create a separate Report Bundle in Calxa for your end of year report. Simply include all the reports listed in this post for your end of year report. When you put all these reports into an end of year report bundle it then becomes effortless next time round you need it. Here is a Sample Report Bundle to give you some ideas.
For more tips on how to create bundles, watch our recording of the annual Financial Year End Reporting Web Chat
To join live, here is the list of our monthly Web Chats.