
We are excited by what’s coming as new in Calxa these next few weeks. Sometimes our preset report templates don’t have quite what you need for your management reports. Fear not! Our next release will allow you to build your own templates with the column layouts you need.
Build your own Report Templates in Calxa
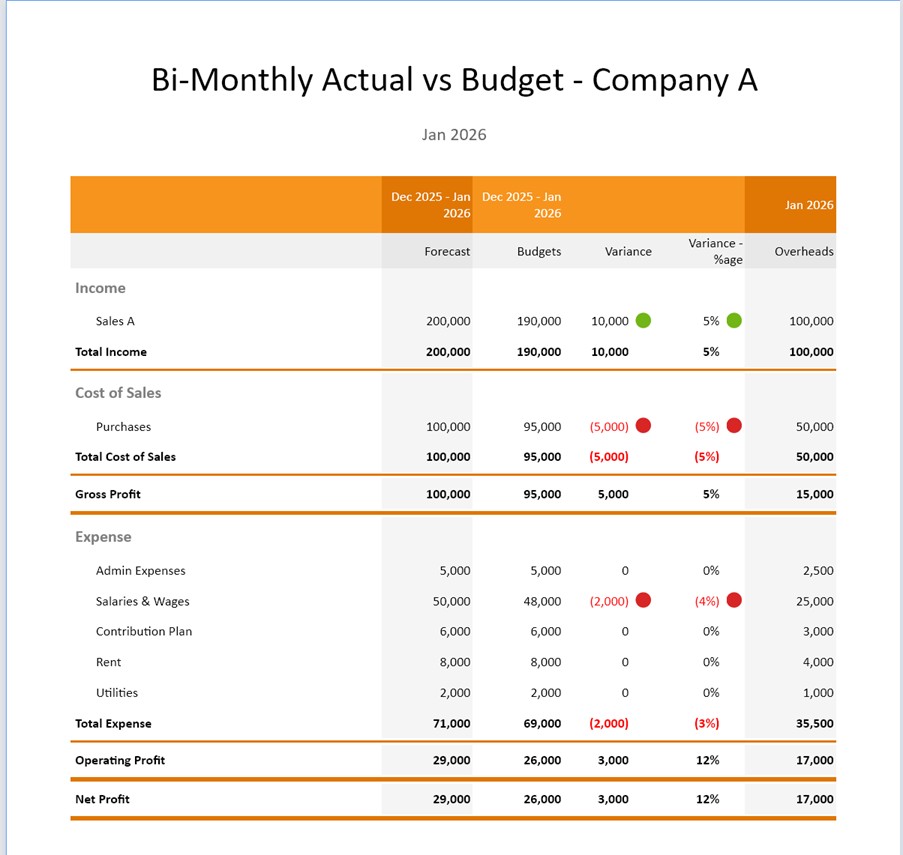
We built our dynamic report builder to give you (almost) limitless flexibility in the columns you include. You can choose from:
- Actuals, any budget and variance
- Different business units by column
- Any date range in each column
Getting Started with Dynamic Templates
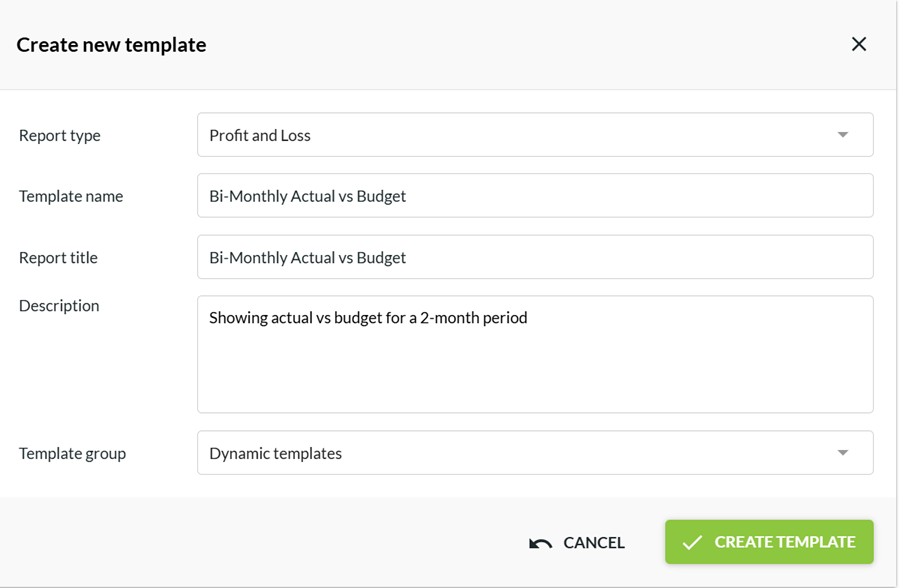
You’ll find the new templates in Reports, Builder, Dynamic Templates. You can add groups to make it easy to sort and find your templates as you and your colleagues add more over time.
Currently you can add templates for Profit & Loss and Balance Sheet reports. Other options are coming later. Give your new template a name, title and description.
Then open the template and start adding columns!
Adding columns to your dynamic template
Once you open the template, click Edit Template and start adding columns. In the first release you can only select a single column at a time but we’re following up soon after with groups and repeating columns. How it works:
- Add the columns you want and configure the date range you want to use.
- You can either pick up the organisation and business units from the main report criteria when you use the template, or you can lock in a selection for each column. The latter option is useful, for example when you want to pick out specific business units to report on by columns.
- Save the template when you’re done and then Run Report to preview your results.
Once you have added your columns you can use familiar drag and drop techniques to move them around. Made a mistake? Just delete the column and add it again.
You have lots of flexibility with the content of your columns:
- Dates can be a single month or year, or any date range at all
- Organisations and business units can be one company, a consolidated group or one or more business units.
- On variance columns you can choose to add traffic light indicators to indicate positive, negative and neutral results.
Report Style updates
On Report Styles you can now define the default colours for negative numbers and the icons and colour sets to use on traffic light indicators. Note that these only apply to dynamic templates (at this stage).
Balance Sheet Templates
When you create dynamic templates for Balance Sheet reports, you can now filter them by business unit to show these values for each of your departments or cost centres. The data we can extract for these does vary by accounting system but we provide the most comprehensive information available.
To see the recent changes, join us for the upcoming release webinar Revamped Calxa Report Builder for Tailored Insights. Or you can read up details in our change log.
There’s lots more we’re working on and coming up as new in Calxa over the next few months.
Feedback is Always Welcome
We value your feedback. To make the most of this feedback, we record every scrap of information we pick up from our day-to-day conversations with you. Here, our quest is to learn what you need. Ultimately, we want to deliver what will help you get your work done easier. So, feel free to give us unsolicited suggestions at any time. Some will take time to implement. However, sometimes we get ideas from customers that are very simple to change and make a big difference.