We all know that advisory is about more than reports. It’s about the conversations you have with your clients that get them thinking. However, reports can be an important catalyst for those conversations, so we’ve put together a selection to get you started. Not all of these top reports for accountants and advisors will be important for every client. Just choose the ones that make most sense.
Report Pack for Accountants and Advisors
Whilst Calxa has over 180 report templates that help many organisations tailor their monthly management reports. It is fair to say that you may not need all of these. So here are our top reports for accountants and advisors:
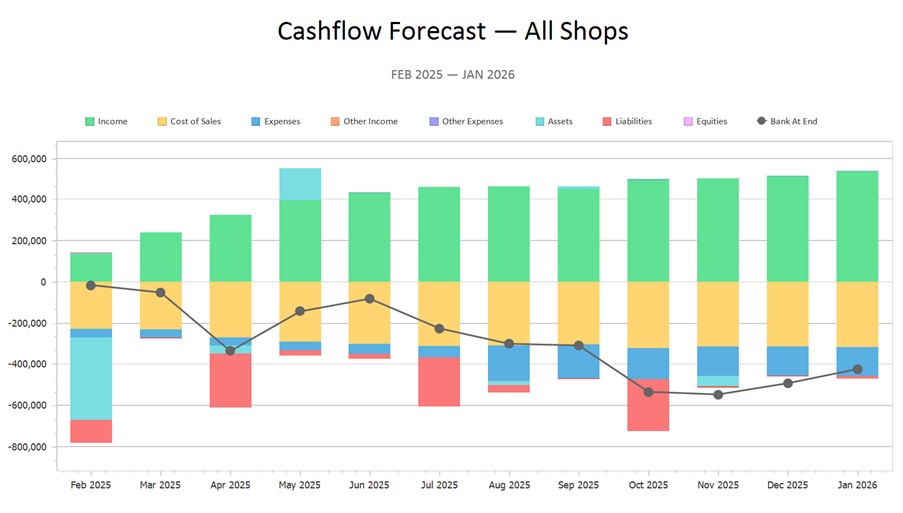
- Cash Flow Forecast Chart
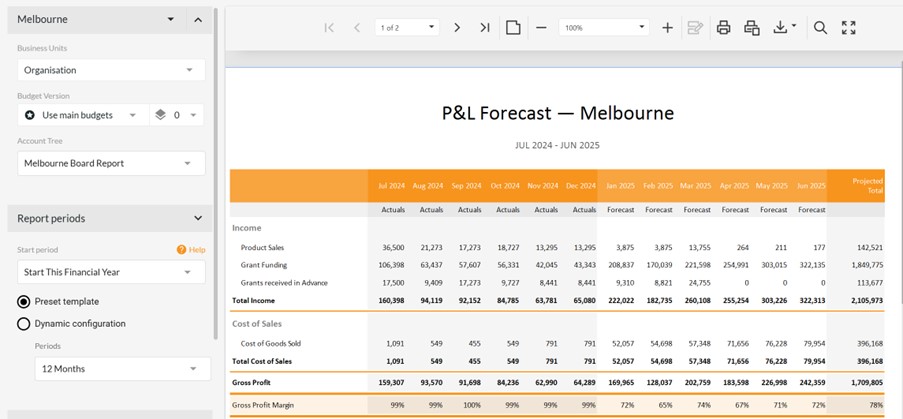
- P&L with Projected Total
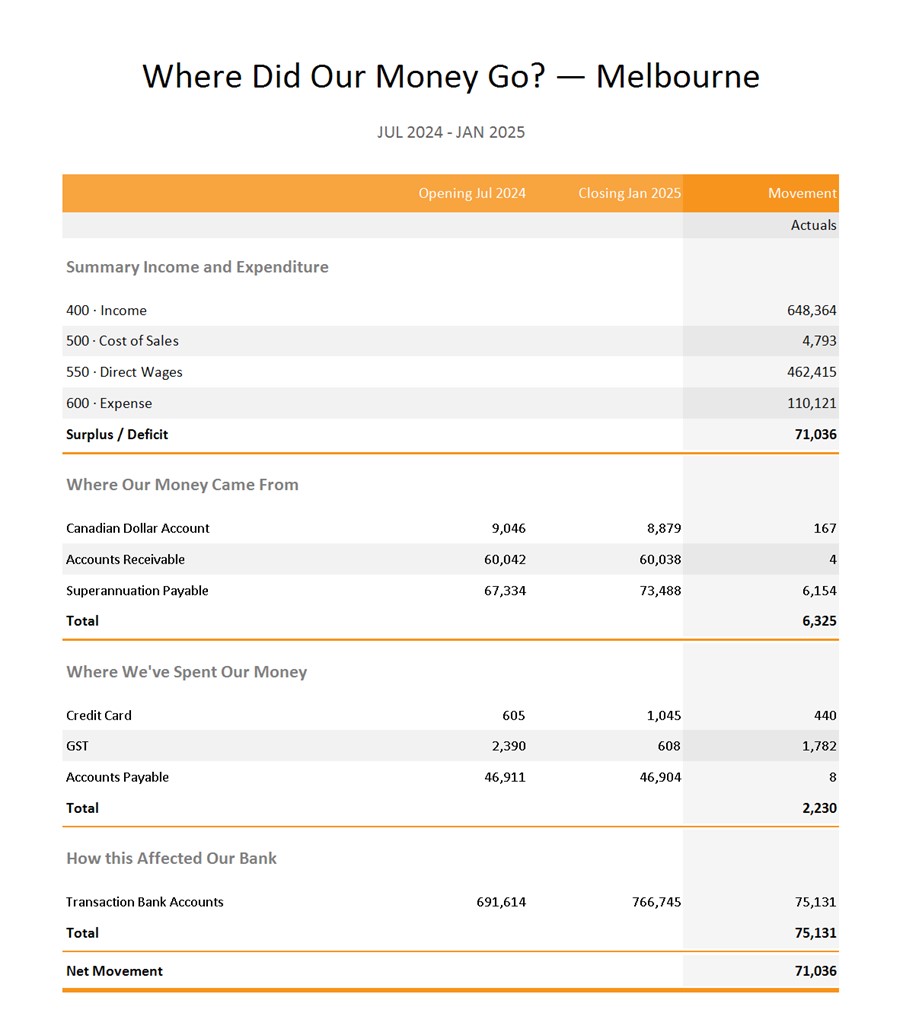
- Where Did Our Money Go?
- Actuals vs Budgets and Last Year
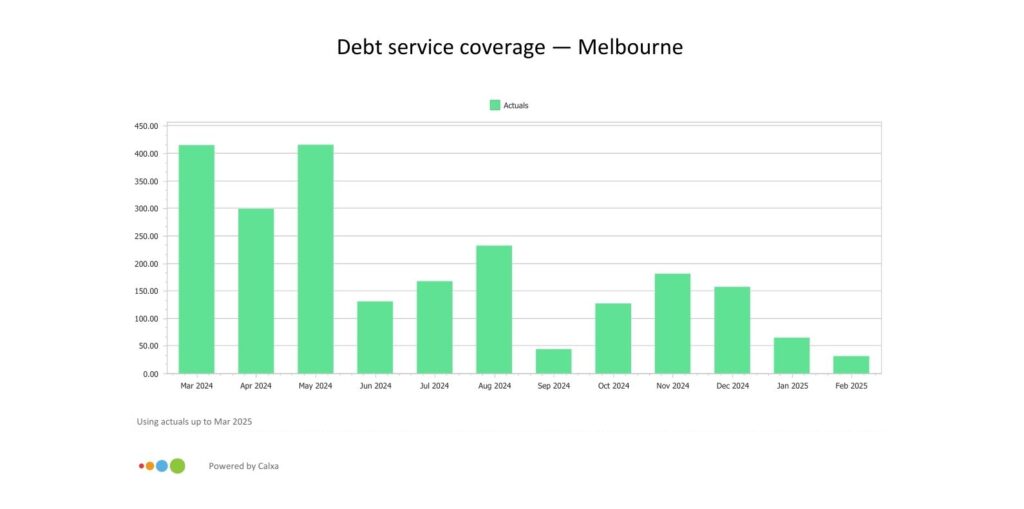
- KPI Analysis Bar Chart (Multi-Period)
Use these reports and you will be on your way to being the accountant and advisor your client needs and expects.
1. The Cash Flow Forecast Chart
Cash Flow is the number one topic for advisory conversations. There aren’t many business owners who have so much cash they don’t need to forecast it. You may find the chart better than the report with numbers. At least for an initial conversation. Here your client will see at a glance if there are problems coming up and when they might be.
12 months is usually a good date range for the first look at this chart. However, you have the flexibility of choosing any number of months, years, or quarters. For most of your business clients, a year is a timeframe that they can manage and understand. We sometimes get clients with more prolonged visions and that is why there is an option to run the chart for up to 10 years. Choose what works best for each of your clients.

While you may not show it to the client, at least initially, it’s a good idea to supplement the chart with the report with numbers. As a result, you can refer to the detail when you are coming up with an action plan but you’re not overwhelming them with pages of figures at the start.
2. P&L with Projected Total
Another common desire of business owners is to look forward to the end of the year and have an idea of where they will end up. As accountants and advisors, it will help to answer common questions like:
- Will I make a profit?
- How does my revenue compare to the budget? Is it falling behind already?
- What tax planning do we need to think of now?
There are a couple of variations to this report. You can choose to keep it simple with just the end of year projection. Alternatively, you can include the comparison to budget, or even the comparison to the original budget.
Depending on how much detail your client likes, it may make sense to use an Account Tree and summarise the report. Especially in the early days of an advisory relationship, it is much easier to discuss the big picture items. How much is being spent overall on administration is usually more important than how much is spent just on telephone. The details make more sense as you progress. However, even then, it is likely to be just some details, not all of them you will want to cover. With an Account Tree, you can show detail for some headings but not for others.
One way of highlighting specific accounts is to add them as a KPI , either within the Account Tree or to the Additional Information section at the end of the report so you can discuss the trends there.
Choose what is important to each client and structure your conversation around that.

3. Where Did Our Money Go?
As accountants and advisors we know that many business owners struggle with the relationship between profit and bank movement. They think that because they have made a profit, there should be a corresponding increase in the bank balance.
The Where Did Our Money Go? report helps them to understand the connection by showing the balance sheet movements.
It shows how they have funded the business and what else they have spent money on. That is usually things like taxes or loan repayments that don’t show in the profit figure. It could be that they are slow at collecting outstanding receivables and that’s impacting their bank balance. Identifying these differences can prompt them to improve their business practices.
Starting to understand the impact of balance sheet movements is an important part of educating your clients. As accountants and advisors you give them an all-round view of their business. This report is something they will easily understand.

4. Actual vs Budget and Last Year
Context is always important with numbers and this report provides it in spades. The Actual vs Budget and Last Year report gives you a couple of options:
- Compare this month to budget or to the same month last year.
- Relate the year-to-date results to budget or, again, the same period in the previous year.
Use this report to talk with your clients about what’s improving and what areas are declining. It will provide the foundations to discuss:
Are things bad just for one month or do the year-to-date figures indicate an ongoing problem?
You can discuss the areas that are going well for the business and also spend time on the parts that need improving. Ask your client if they:
- Know why the numbers are down.
- Is there more information they need to gather to determine the root causes of the decline?
- Who else do they need to involve in the conversation?
If you are looking for a conversation starter, this report will give you plenty.
5. KPI Analysis Bar Chart (Multi-Period)
Finally, a KPI or 2, is always useful for focussing on a special area for each client. For some it might be transaction values, for others it could be debtor days. Whatever you and the client decide is the most important number to monitor the health of the business, track it regularly over time.
The chart gives a visual representation of the information, making it easy for your client to understand. Its timescale is fully flexible in that you can choose any number of months, years or quarters. Use this to take a high-level or detailed view as appropriate and watch the trends over time.
KPIs are great for helping your client focus on fixing one thing at a time. You can help them track their progress and show what’s working or what’s not. Sometimes it makes sense to track 2-3 related KPIs and put them on a dashboard. For example, if the goal is to increase revenue, you may use a KPI chart to track that. In addition, supplement it with another that shows the average transaction value. If that increases, does it drive an increase in the total income?

Getting Started with Reports for Accountants and Advisors
As we said at the beginning, management reports are just part of what is needed at becoming your client’s favourite accountant and advisor. Reports are the catalyst to start a conversation and engage your client in thinking about their business. Choosing the right reports helps to get that conversation going. They need to be at the right level of details for your client’s needs and understanding.
If you’re still at the thinking and planning stage, check out Katrina Aarsman’s article on How to Get Started with Business Advisory Services. There are good tips there to help you on the way.
Also use our Best Practice Management Reporting Guide to set up your framework. Once you’ve started, these top reports for accountants and advisors will help you deliver a great service to your clients.
